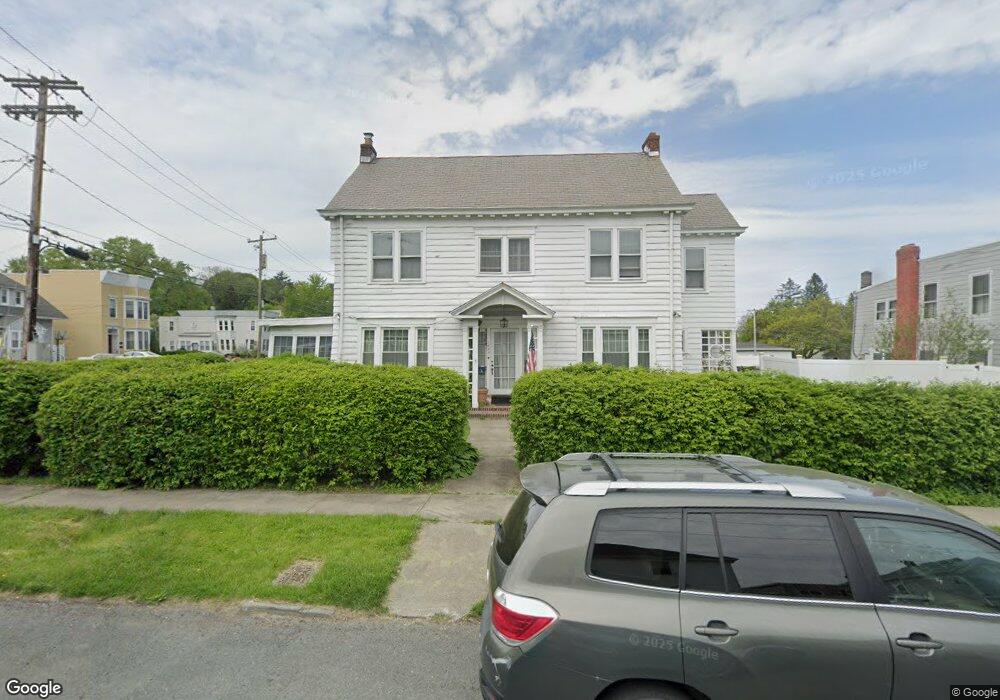
1039 23rd St Watervliet, NY 12189
Estimated Value: $238,000 - $340,000
4
Beds
2
Baths
2,272
Sq Ft
$130/Sq Ft
Est. Value
About This Home
This home is located at 1039 23rd St, Watervliet, NY 12189 and is currently estimated at $294,410, approximately $129 per square foot. 1039 23rd St is a home located in Albany County with nearby schools including Watervliet Elementary School, Watervliet Junior/Senior High School, and KIPP Troy Prep High School.
Ownership History
Date
Name
Owned For
Owner Type
Purchase Details
Closed on
Mar 2, 2010
Sold by
Fogarty Ellen R
Bought by
Fogarty Ellen R
Current Estimated Value
Home Financials for this Owner
Home Financials are based on the most recent Mortgage that was taken out on this home.
Original Mortgage
$117,600
Outstanding Balance
$78,021
Interest Rate
5%
Mortgage Type
New Conventional
Estimated Equity
$216,389
Purchase Details
Closed on
Mar 8, 2006
Sold by
Fogarty Maragaret R
Bought by
Fogarty Ellen R
Purchase Details
Closed on
Feb 24, 1997
Create a Home Valuation Report for This Property
The Home Valuation Report is an in-depth analysis detailing your home's value as well as a comparison with similar homes in the area
Home Values in the Area
Average Home Value in this Area
Purchase History
| Date | Buyer | Sale Price | Title Company |
|---|---|---|---|
| Fogarty Ellen R | -- | None Available | |
| Fogarty Ellen R | -- | None Available | |
| -- | -- | -- |
Source: Public Records
Mortgage History
| Date | Status | Borrower | Loan Amount |
|---|---|---|---|
| Open | Fogarty Ellen R | $117,600 |
Source: Public Records
Tax History Compared to Growth
Tax History
| Year | Tax Paid | Tax Assessment Tax Assessment Total Assessment is a certain percentage of the fair market value that is determined by local assessors to be the total taxable value of land and additions on the property. | Land | Improvement |
|---|---|---|---|---|
| 2024 | $6,662 | $184,000 | $36,800 | $147,200 |
| 2023 | $6,614 | $184,000 | $36,800 | $147,200 |
| 2022 | $5,979 | $184,000 | $36,800 | $147,200 |
| 2021 | $5,914 | $184,000 | $36,800 | $147,200 |
| 2020 | $5,745 | $184,000 | $36,800 | $147,200 |
| 2019 | $5,708 | $184,000 | $36,800 | $147,200 |
| 2018 | $5,613 | $184,000 | $36,800 | $147,200 |
| 2017 | $4,775 | $184,000 | $36,800 | $147,200 |
| 2016 | $5,049 | $184,000 | $36,800 | $147,200 |
| 2015 | -- | $169,000 | $36,800 | $132,200 |
| 2014 | -- | $169,000 | $36,800 | $132,200 |
Source: Public Records
Map
Nearby Homes