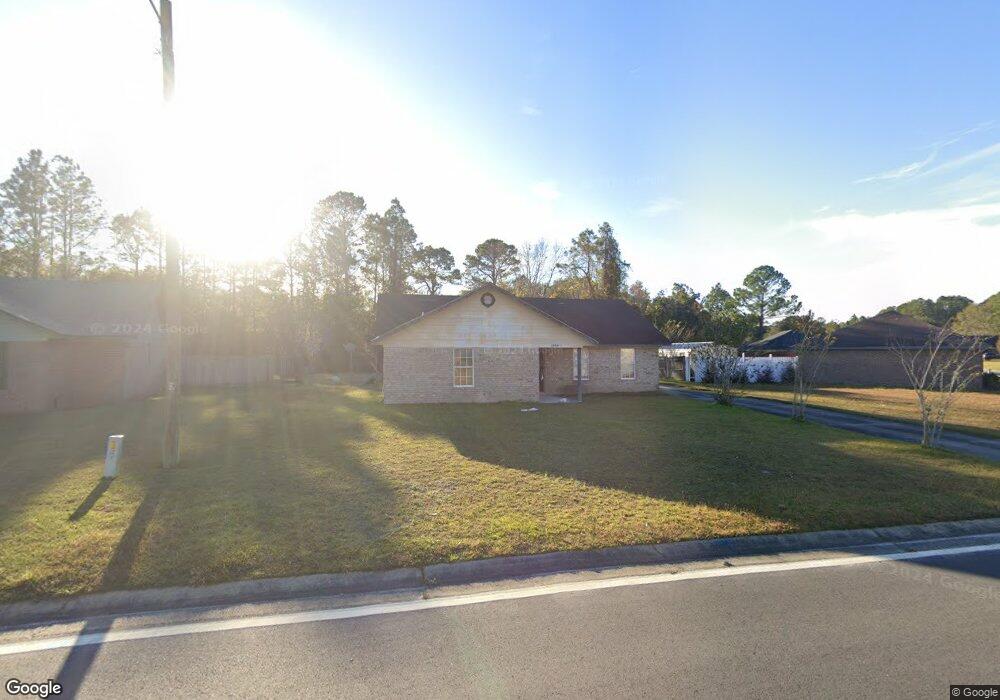
1039 Barley Dr Hinesville, GA 31313
Estimated Value: $223,742 - $232,000
3
Beds
2
Baths
1,700
Sq Ft
$135/Sq Ft
Est. Value
About This Home
This home is located at 1039 Barley Dr, Hinesville, GA 31313 and is currently estimated at $229,186, approximately $134 per square foot. 1039 Barley Dr is a home located in Liberty County with nearby schools including Taylors Creek Elementary School, Lewis Frasier Middle School, and Bradwell Institute.
Ownership History
Date
Name
Owned For
Owner Type
Purchase Details
Closed on
Aug 15, 2000
Sold by
Sec Of V A
Bought by
Lewis William M & Tr
Current Estimated Value
Purchase Details
Closed on
Jan 4, 2000
Sold by
Fleet Mortgage Corp
Bought by
Sec Of V A
Purchase Details
Closed on
Sep 18, 1998
Sold by
Ka Jon Homes Inc
Bought by
Oliver Maria L S
Purchase Details
Closed on
Jul 7, 1998
Sold by
Ka-Jon Homes Inc
Bought by
Ka Jon Homes Inc
Create a Home Valuation Report for This Property
The Home Valuation Report is an in-depth analysis detailing your home's value as well as a comparison with similar homes in the area
Home Values in the Area
Average Home Value in this Area
Purchase History
| Date | Buyer | Sale Price | Title Company |
|---|---|---|---|
| Lewis William M & Tr | $70,000 | -- | |
| Sec Of V A | -- | -- | |
| Fleet Mortgage Corp | $61,500 | -- | |
| Oliver Maria L S | $70,900 | -- | |
| Ka Jon Homes Inc | -- | -- |
Source: Public Records
Tax History Compared to Growth
Tax History
| Year | Tax Paid | Tax Assessment Tax Assessment Total Assessment is a certain percentage of the fair market value that is determined by local assessors to be the total taxable value of land and additions on the property. | Land | Improvement |
|---|---|---|---|---|
| 2024 | $3,793 | $77,238 | $14,000 | $63,238 |
| 2023 | $3,793 | $65,962 | $12,000 | $53,962 |
| 2022 | $2,490 | $53,434 | $12,000 | $41,434 |
| 2021 | $2,319 | $48,822 | $12,000 | $36,822 |
| 2020 | $2,187 | $45,582 | $10,000 | $35,582 |
| 2019 | $2,191 | $46,016 | $10,000 | $36,016 |
| 2018 | $2,199 | $46,450 | $10,000 | $36,450 |
| 2017 | $1,544 | $46,884 | $10,000 | $36,884 |
| 2016 | $1,983 | $43,941 | $8,400 | $35,541 |
| 2015 | $2,132 | $44,741 | $9,200 | $35,541 |
| 2014 | $2,132 | $46,768 | $9,200 | $37,568 |
| 2013 | -- | $44,538 | $8,000 | $36,538 |
Source: Public Records
Map
Nearby Homes
- 1.17 ACRES Elam Rd
- 851 Lyndsi Ln
- 776 Burnt Pines Rd NE
- 1802 White Cedar Way
- 303 Camden Ct
- 0 Airport Rd Unit 325633
- 1596 Longleaf Ct
- 164 Glynn Ct
- 201 Slayton Cir
- 33 Bryan Way
- 1295 Windrow Dr
- 2716 Java Ct
- 2563 Zachary Ct
- 104 Shallowford Cir
- 1231 Pineridge Way
- 1302 Loblolly Dr
- 215 Worthington Dr NE
- 1240 Pineridge Way
- 269 Brightleaf Cir
- 1325 Loblolly Dr
- 1037 Barley Dr
- 1041 Barley Dr
- 0 Barley Dr Unit 8358539
- 0 Barley Dr Unit 8039139
- 0 Barley Dr Unit 2955222
- 0 Barley Dr Unit 3160646
- 0 Barley Dr Unit 7285187
- 0 Barley Dr
- 1030 Barley Dr
- 1043 Barley Dr
- 1035 Barley Dr
- 1032 Barley Dr
- 1034 Barley Dr
- 1028 Barley Dr
- 1036 Barley Dr
- 1033 Barley Dr
- 1026 Barley Dr
- 1038 Barley Dr
- 1024 Barley Dr
- 1031 Barley Dr