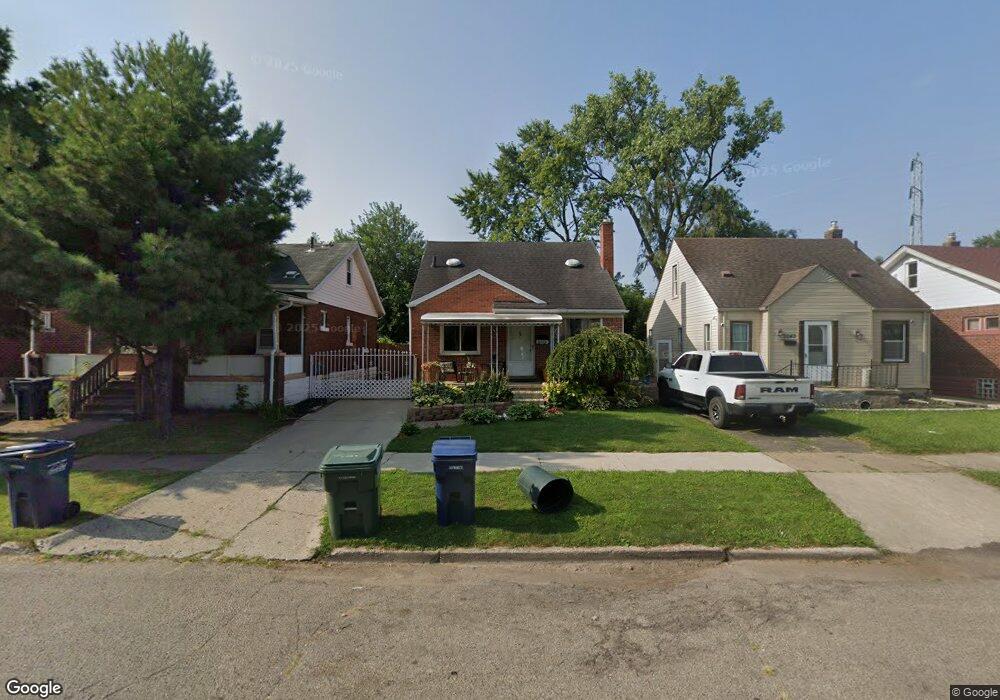
1039 Garfield Ave Lincoln Park, MI 48146
Estimated Value: $157,000 - $196,000
3
Beds
1
Bath
1,000
Sq Ft
$168/Sq Ft
Est. Value
About This Home
This home is located at 1039 Garfield Ave, Lincoln Park, MI 48146 and is currently estimated at $167,804, approximately $167 per square foot. 1039 Garfield Ave is a home located in Wayne County with nearby schools including Keppen School, Lincoln Park Middle School, and Lincoln Park High School.
Ownership History
Date
Name
Owned For
Owner Type
Purchase Details
Closed on
Jul 24, 2008
Sold by
Yarimian John and Yarimian Ying
Bought by
Federal National Mortgage Association
Current Estimated Value
Purchase Details
Closed on
Aug 9, 2007
Sold by
Brikho Maisa
Bought by
Yarimian John
Purchase Details
Closed on
Nov 9, 2004
Sold by
Hud
Bought by
Brikho Maisa
Home Financials for this Owner
Home Financials are based on the most recent Mortgage that was taken out on this home.
Original Mortgage
$73,800
Interest Rate
7.95%
Mortgage Type
Purchase Money Mortgage
Purchase Details
Closed on
Nov 3, 2003
Sold by
Citimortgage Inc
Bought by
Hud
Purchase Details
Closed on
May 14, 2003
Sold by
Tobin Patrick J and Tobin Maureen
Bought by
Citimortgage Inc
Purchase Details
Closed on
Jan 26, 2000
Sold by
Brooks Giles N
Bought by
Tobin Patrick J
Purchase Details
Closed on
Apr 18, 1994
Sold by
Bankers Trust Co Of Ca
Bought by
Janine L Ziesmer
Create a Home Valuation Report for This Property
The Home Valuation Report is an in-depth analysis detailing your home's value as well as a comparison with similar homes in the area
Home Values in the Area
Average Home Value in this Area
Purchase History
| Date | Buyer | Sale Price | Title Company |
|---|---|---|---|
| Federal National Mortgage Association | $104,862 | None Available | |
| Yarimian John | $125,000 | American Premier Title | |
| Brikho Maisa | $82,000 | American Title Company | |
| Hud | -- | -- | |
| Citimortgage Inc | $119,091 | -- | |
| Tobin Patrick J | $97,900 | -- | |
| Janine L Ziesmer | $52,000 | -- |
Source: Public Records
Mortgage History
| Date | Status | Borrower | Loan Amount |
|---|---|---|---|
| Previous Owner | Brikho Maisa | $73,800 |
Source: Public Records
Tax History Compared to Growth
Tax History
| Year | Tax Paid | Tax Assessment Tax Assessment Total Assessment is a certain percentage of the fair market value that is determined by local assessors to be the total taxable value of land and additions on the property. | Land | Improvement |
|---|---|---|---|---|
| 2025 | $1,658 | $72,400 | $0 | $0 |
| 2024 | $1,658 | $64,700 | $0 | $0 |
| 2023 | $1,572 | $59,800 | $0 | $0 |
| 2022 | $1,858 | $48,100 | $0 | $0 |
| 2021 | $1,818 | $46,500 | $0 | $0 |
| 2020 | $1,802 | $39,500 | $0 | $0 |
| 2019 | $1,424 | $34,500 | $0 | $0 |
| 2018 | $1,283 | $32,600 | $0 | $0 |
| 2017 | $937 | $30,600 | $0 | $0 |
| 2016 | $1,668 | $31,600 | $0 | $0 |
| 2015 | $3,090 | $30,900 | $0 | $0 |
| 2013 | $3,170 | $32,400 | $0 | $0 |
| 2012 | $1,952 | $34,100 | $5,100 | $29,000 |
Source: Public Records
Map
Nearby Homes
- 1027 Park Ave
- 881 Garfield Ave
- 1194 Lincoln Ave
- 880 White Ave
- 1115 Mill St
- 1125 Mill St
- 1187 Park Ave
- 1042 Champaign Rd
- 2419 Chandler Ave
- 1208 Mill St
- 817 Lincoln Ave
- 1184 Farnham Ave
- 1215 Mill St
- 853 Mill St
- 1673 Ferris Ave
- 878 Champaign Rd
- 1622 Wilson Ave
- 764 White Ave
- 1654 Chandler Ave
- 1151 Progress Ave
- 1035 Garfield Ave
- 1043 Garfield Ave Unit Bldg-Unit
- 1043 Garfield Ave
- 1053 Garfield Ave
- 1029 Garfield Ave
- 1040 Lincoln Ave
- 1025 Garfield Ave
- 1057 Garfield Ave
- 1034 Lincoln Ave
- 1021 Garfield Ave
- 1061 Garfield Ave
- 1030 Lincoln Ave
- 1044 Garfield Ave
- 1067 Garfield Ave
- 1034 Garfield Ave
- 1054 Garfield Ave
- 1026 Lincoln Ave
- 1030 Garfield Ave
- 1026 Garfield Ave
- 1015 Garfield Ave