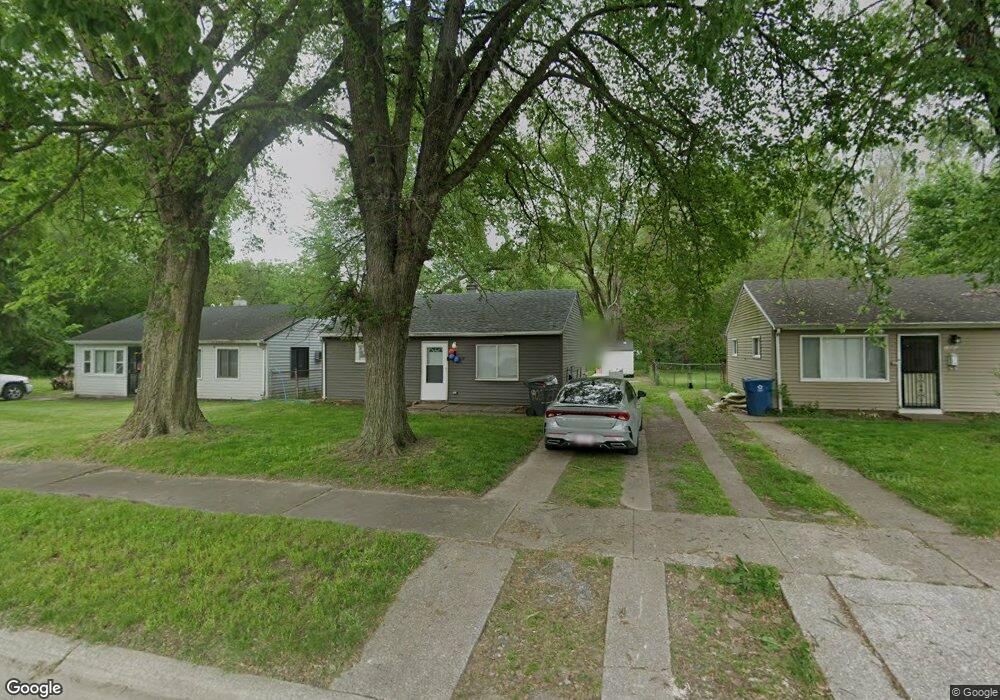
1039 Hanley St Gary, IN 46406
Westside NeighborhoodEstimated Value: $74,000 - $92,000
2
Beds
1
Bath
780
Sq Ft
$109/Sq Ft
Est. Value
About This Home
This home is located at 1039 Hanley St, Gary, IN 46406 and is currently estimated at $85,249, approximately $109 per square foot. 1039 Hanley St is a home with nearby schools including Bailly Preparatory Academy, West Side Leadership Academy, and Aspire Charter Academy.
Ownership History
Date
Name
Owned For
Owner Type
Purchase Details
Closed on
Aug 23, 2024
Sold by
Amruta Llc
Bought by
Mar Elliot W and Tenoric Jake R
Current Estimated Value
Home Financials for this Owner
Home Financials are based on the most recent Mortgage that was taken out on this home.
Original Mortgage
$51,000
Outstanding Balance
$50,413
Interest Rate
6.78%
Mortgage Type
New Conventional
Estimated Equity
$34,836
Purchase Details
Closed on
Feb 24, 2021
Sold by
Jefferson Roosevelt
Bought by
Ace Nwi Llc
Purchase Details
Closed on
Feb 22, 2021
Sold by
Ace Nwi Llc
Bought by
Amruta Llc
Purchase Details
Closed on
Feb 2, 2021
Sold by
Ace Nwi Llc
Bought by
Amruta Llc
Purchase Details
Closed on
Sep 26, 2019
Sold by
County Of Lake
Bought by
Jefferson Roosevelt
Purchase Details
Closed on
Apr 1, 2017
Sold by
Williams Marion
Bought by
Northwest Indiana Community Development
Purchase Details
Closed on
Jan 5, 2007
Sold by
Johnson Julius R and Johnson Julius
Bought by
Williams Marion
Create a Home Valuation Report for This Property
The Home Valuation Report is an in-depth analysis detailing your home's value as well as a comparison with similar homes in the area
Home Values in the Area
Average Home Value in this Area
Purchase History
| Date | Buyer | Sale Price | Title Company |
|---|---|---|---|
| Mar Elliot W | -- | Chicago Title | |
| Ace Nwi Llc | $27,500 | Indiana Title Network Co | |
| Amruta Llc | -- | Indiana Title Network | |
| Ace Nwi Llc | -- | Indiana Title Network | |
| Amruta Llc | $55,000 | Indiana Title Network Co | |
| Jefferson Roosevelt | $500 | None Available | |
| Northwest Indiana Community Development | -- | None Available | |
| Williams Marion | -- | None Available |
Source: Public Records
Mortgage History
| Date | Status | Borrower | Loan Amount |
|---|---|---|---|
| Open | Mar Elliot W | $51,000 |
Source: Public Records
Tax History Compared to Growth
Tax History
| Year | Tax Paid | Tax Assessment Tax Assessment Total Assessment is a certain percentage of the fair market value that is determined by local assessors to be the total taxable value of land and additions on the property. | Land | Improvement |
|---|---|---|---|---|
| 2024 | $4,435 | $54,400 | $8,800 | $45,600 |
| 2023 | $776 | $50,300 | $8,800 | $41,500 |
| 2022 | $776 | $30,300 | $5,900 | $24,400 |
| 2021 | $725 | $28,300 | $5,900 | $22,400 |
| 2020 | $638 | $24,900 | $5,900 | $19,000 |
| 2019 | $464 | $20,200 | $5,900 | $14,300 |
| 2018 | $1,203 | $20,200 | $5,900 | $14,300 |
| 2017 | $473 | $20,500 | $5,900 | $14,600 |
| 2016 | $640 | $28,600 | $5,900 | $22,700 |
| 2014 | $688 | $29,400 | $6,700 | $22,700 |
| 2013 | $703 | $31,300 | $6,700 | $24,600 |
Source: Public Records
Map
Nearby Homes
- 1047 Ralston St
- 1045 - 1051 Durbin St
- 982 Ralston St
- 1035 Clinton St
- 1124 Clinton St
- 1152 Hovey St
- 1395 Ralston St
- 1528 Hanley St
- 735 Burr St
- 1529 Hovey St
- 730 Matthews St
- 4408 W 10th Ave
- 621 Burr St
- 4838 W 6th Ave
- 349 Hamlin St
- 1564 Baker St
- 968 Baker St
- 4120 W 11th Ave
- 952 Willard St
- 1035 Willard St
- 1045 Hanley St
- 1033 Hanley St
- 1051 Hanley St
- 1025 Hanley St
- 1048 Hanley St Unit 54
- 1056 Hanley St Unit 62
- 1057 Hanley St
- 1038 Durbin St
- 1032 Durbin St
- 1044 Durbin St
- 1024 Durbin St
- 1050 Durbin St
- 1013 Hanley St
- 1070 Hanley St
- 1028 Hanley St
- 1056 Durbin St
- 1020 Hanley St
- 1007 Hanley St
- 5130 W 11th Ave
- 5138 W 11th Ave