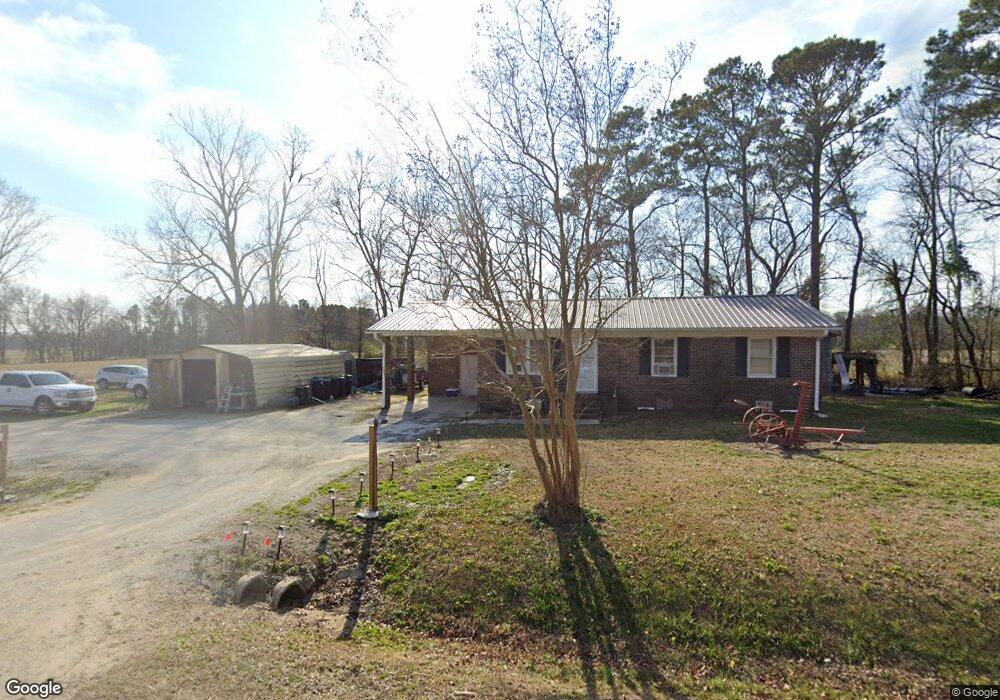
1039 Huffmantown Rd Richlands, NC 28574
Estimated Value: $124,000 - $192,000
3
Beds
1
Bath
1,025
Sq Ft
$166/Sq Ft
Est. Value
About This Home
This home is located at 1039 Huffmantown Rd, Richlands, NC 28574 and is currently estimated at $169,829, approximately $165 per square foot. 1039 Huffmantown Rd is a home located in Onslow County with nearby schools including Richlands Elementary School, Trexler Middle School, and Richlands High School.
Ownership History
Date
Name
Owned For
Owner Type
Purchase Details
Closed on
Dec 31, 2018
Sold by
Brown June Allyson and The Estate Of Atlas H Brown
Bought by
Brown June H
Current Estimated Value
Purchase Details
Closed on
Jul 27, 1993
Bought by
Futrell Robert L and Futrell Judy M
Create a Home Valuation Report for This Property
The Home Valuation Report is an in-depth analysis detailing your home's value as well as a comparison with similar homes in the area
Home Values in the Area
Average Home Value in this Area
Purchase History
| Date | Buyer | Sale Price | Title Company |
|---|---|---|---|
| Brown June H | -- | None Available | |
| Futrell Robert L | $40,000 | -- |
Source: Public Records
Tax History Compared to Growth
Tax History
| Year | Tax Paid | Tax Assessment Tax Assessment Total Assessment is a certain percentage of the fair market value that is determined by local assessors to be the total taxable value of land and additions on the property. | Land | Improvement |
|---|---|---|---|---|
| 2025 | $604 | $92,262 | $28,560 | $63,702 |
| 2024 | $604 | $92,262 | $28,560 | $63,702 |
| 2023 | $604 | $92,262 | $28,560 | $63,702 |
| 2022 | $604 | $92,262 | $28,560 | $63,702 |
| 2021 | $498 | $70,590 | $20,940 | $49,650 |
| 2020 | $498 | $70,590 | $20,940 | $49,650 |
| 2019 | $498 | $70,590 | $20,940 | $49,650 |
| 2018 | $498 | $70,590 | $20,940 | $49,650 |
| 2017 | $508 | $75,280 | $20,940 | $54,340 |
| 2016 | $508 | $75,280 | $0 | $0 |
| 2015 | $508 | $75,280 | $0 | $0 |
| 2014 | $508 | $75,280 | $0 | $0 |
Source: Public Records
Map
Nearby Homes
- Tract 1 Barbee Rd
- GALEN Plan at Driftwood
- MANNING Plan at Driftwood
- KERRY Plan at Driftwood
- CALI Plan at Driftwood
- 408 Driftwood Dr
- 408 Driftwood Dr Unit Lot 3
- 412 Driftwood Dr
- 412 Driftwood Dr Unit Lot 5
- 410 Driftwood Dr
- 410 Driftwood Dr Unit Lot 4
- 418 Driftwood Dr Unit Lot 7
- 418 Driftwood Dr
- 409 Driftwood Dr Unit Lot 47
- 409 Driftwood Dr
- 415 Driftwood Dr
- 170 Cavanaughtown Rd
- 315 Haywood Dr
- 255 Deer Haven Dr
- 404 Silva Cove
- 1044 Huffmantown Rd
- 1032 Huffmantown Rd
- 1021 Huffmantown Rd
- 1020 Huffmantown Rd
- 1068 Huffmantown Rd
- 1076 Huffmantown Rd
- 1000 Huffmantown Rd
- 1090 Huffmantown Rd
- 1094 Huffmantown Rd
- 987 Huffmantown Rd
- 1102 Huffmantown Rd
- 1006 Huffmantown Rd
- 1110 Huffmantown Rd
- 647 Barbee Rd
- 1122 Huffmantown Rd
- 569 Barbee Rd
- 1116 Huffmantown Rd
- 588 Barbee Rd
- 1126 Huffmantown Rd
- 1137 Huffmantown Rd