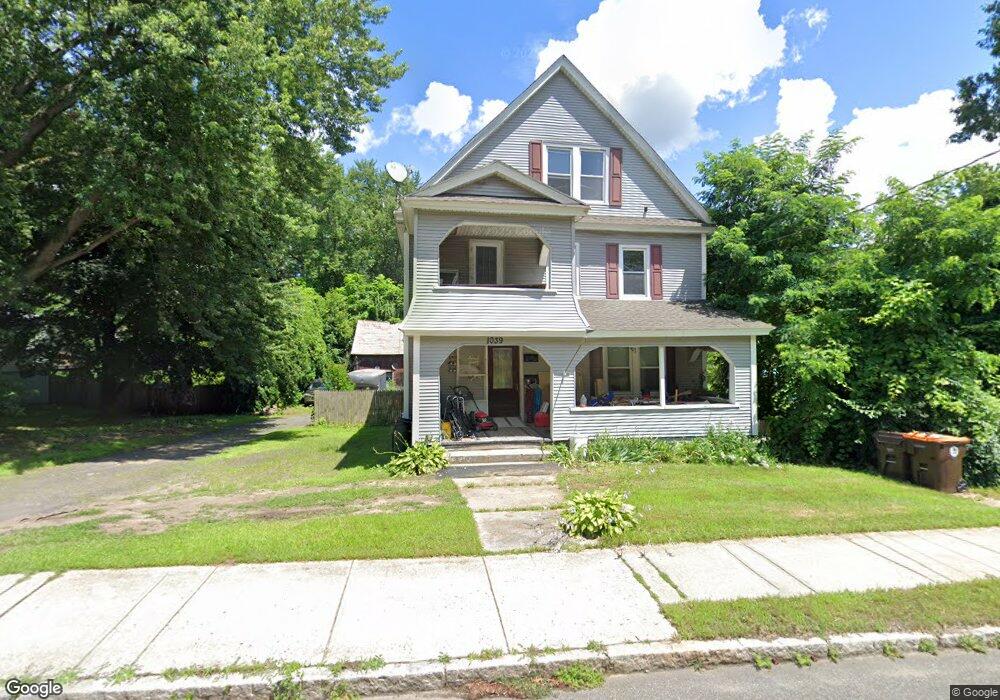
1039 Main St Agawam, MA 01001
Estimated Value: $376,000 - $432,000
3
Beds
2
Baths
1,668
Sq Ft
$241/Sq Ft
Est. Value
About This Home
This home is located at 1039 Main St, Agawam, MA 01001 and is currently estimated at $401,264, approximately $240 per square foot. 1039 Main St is a home located in Hampden County with nearby schools including Agawam Junior High School, Agawam High School, and St Thomas The Apostle School.
Ownership History
Date
Name
Owned For
Owner Type
Purchase Details
Closed on
Oct 15, 2019
Sold by
Fedier Thersa
Bought by
Fedier James
Current Estimated Value
Purchase Details
Closed on
May 15, 2019
Sold by
Fedier John J Est
Bought by
Fedier Theresa
Purchase Details
Closed on
Feb 26, 1997
Sold by
White Dorothy I
Bought by
Fedier John J
Home Financials for this Owner
Home Financials are based on the most recent Mortgage that was taken out on this home.
Original Mortgage
$77,350
Interest Rate
7.78%
Mortgage Type
Purchase Money Mortgage
Create a Home Valuation Report for This Property
The Home Valuation Report is an in-depth analysis detailing your home's value as well as a comparison with similar homes in the area
Home Values in the Area
Average Home Value in this Area
Purchase History
| Date | Buyer | Sale Price | Title Company |
|---|---|---|---|
| Fedier James | -- | -- | |
| Fedier James | -- | -- | |
| Fedier Theresa | -- | -- | |
| Fedier John J | $119,000 | -- |
Source: Public Records
Mortgage History
| Date | Status | Borrower | Loan Amount |
|---|---|---|---|
| Previous Owner | Fedier John J | $77,350 |
Source: Public Records
Tax History Compared to Growth
Tax History
| Year | Tax Paid | Tax Assessment Tax Assessment Total Assessment is a certain percentage of the fair market value that is determined by local assessors to be the total taxable value of land and additions on the property. | Land | Improvement |
|---|---|---|---|---|
| 2025 | $4,718 | $322,300 | $122,600 | $199,700 |
| 2024 | $4,582 | $315,100 | $122,600 | $192,500 |
| 2023 | $4,259 | $269,900 | $102,100 | $167,800 |
| 2022 | $3,934 | $244,200 | $102,100 | $142,100 |
| 2021 | $3,898 | $232,000 | $90,300 | $141,700 |
| 2020 | $3,773 | $224,200 | $89,100 | $135,100 |
| 2019 | $3,615 | $217,100 | $87,400 | $129,700 |
| 2018 | $3,427 | $206,300 | $86,300 | $120,000 |
| 2017 | $3,252 | $199,400 | $86,300 | $113,100 |
| 2016 | $3,226 | $199,400 | $86,300 | $113,100 |
| 2015 | $3,065 | $194,700 | $86,300 | $108,400 |
Source: Public Records
Map
Nearby Homes
- 15 Bailey St
- 969 Main St
- 52 Peros Dr
- 869-871 Main St
- 111 Cottonwood Ln
- 209 Pineview Cir
- 144 Mallard Cir
- 15 B Castle Hills Rd Unit B
- 4H Mapleviewlane Unit 4H
- 20 Castle Hill Rd Unit D
- 0 Silver St
- 25 Castle Hill Rd Unit E
- 4 H Castle Hills Rd Unit H
- 1 Castle Hill Rd Unit D
- 82 West Rd
- 25 Clifton Dr
- 95 Meadowbrook Rd
- 49 Hearthstone Dr
- 64 Woodside Dr
- 73 Silver Lake Dr