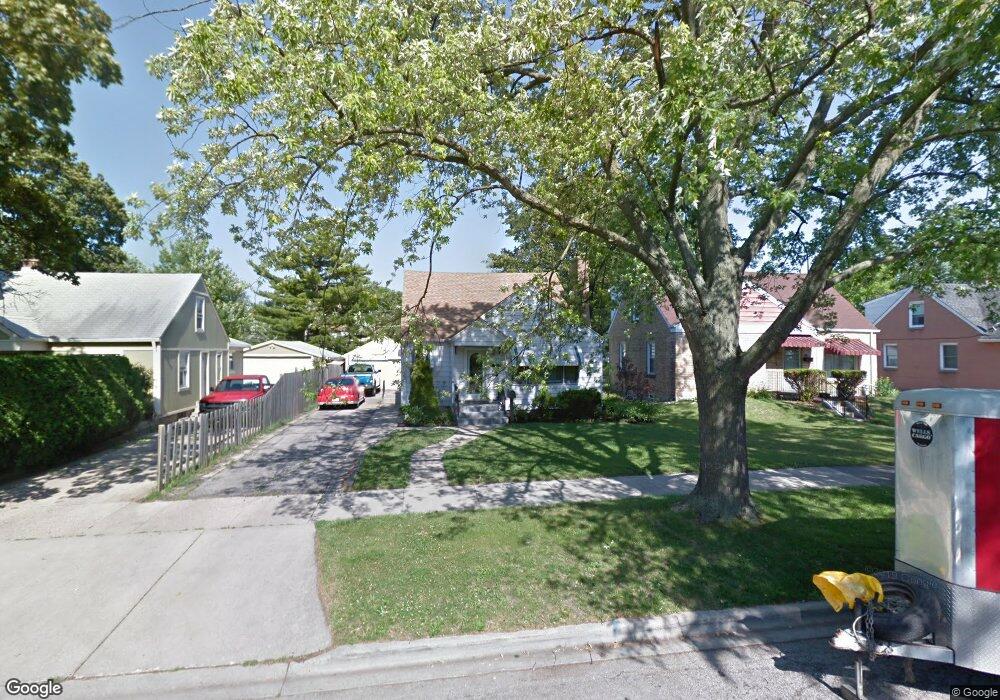
1039 Muirfield Ave Waukegan, IL 60085
Glenwood Heights NeighborhoodEstimated Value: $253,205 - $306,000
3
Beds
2
Baths
1,598
Sq Ft
$171/Sq Ft
Est. Value
About This Home
This home is located at 1039 Muirfield Ave, Waukegan, IL 60085 and is currently estimated at $273,301, approximately $171 per square foot. 1039 Muirfield Ave is a home located in Lake County with nearby schools including Glenwood Elementary School, Miguel Juarez Middle School, and Waukegan High School.
Ownership History
Date
Name
Owned For
Owner Type
Purchase Details
Closed on
Jun 26, 2004
Sold by
Salgado Walfre and Salgado Nelly
Bought by
Salgado Jose Walfare and Salgado Maria Marta
Current Estimated Value
Purchase Details
Closed on
May 2, 2003
Sold by
Salgado Jose Walfre and Salgado Walfre
Bought by
Salgado Jose W and Salgado Walfre
Home Financials for this Owner
Home Financials are based on the most recent Mortgage that was taken out on this home.
Original Mortgage
$105,950
Interest Rate
5.9%
Mortgage Type
Purchase Money Mortgage
Purchase Details
Closed on
Sep 23, 1997
Sold by
Snider Craig T and Snider Lisa M
Bought by
Salgado Walfre and Salgado Jose Walfre
Home Financials for this Owner
Home Financials are based on the most recent Mortgage that was taken out on this home.
Original Mortgage
$112,986
Interest Rate
7.65%
Mortgage Type
FHA
Purchase Details
Closed on
Jun 13, 1997
Sold by
Bank Of Waukegan
Bought by
Snider Craig T and Snider Lisa M
Home Financials for this Owner
Home Financials are based on the most recent Mortgage that was taken out on this home.
Original Mortgage
$70,505
Interest Rate
8%
Mortgage Type
Seller Take Back
Purchase Details
Closed on
Jan 29, 1997
Sold by
Delre Gary
Bought by
Bank Of Waukegan
Create a Home Valuation Report for This Property
The Home Valuation Report is an in-depth analysis detailing your home's value as well as a comparison with similar homes in the area
Home Values in the Area
Average Home Value in this Area
Purchase History
| Date | Buyer | Sale Price | Title Company |
|---|---|---|---|
| Salgado Jose Walfare | -- | -- | |
| Salgado Jose W | -- | -- | |
| Salgado Walfre | $76,000 | -- | |
| Snider Craig T | $71,500 | -- | |
| Bank Of Waukegan | -- | -- |
Source: Public Records
Mortgage History
| Date | Status | Borrower | Loan Amount |
|---|---|---|---|
| Closed | Salgado Jose W | $105,950 | |
| Closed | Salgado Walfre | $112,986 | |
| Previous Owner | Snider Craig T | $70,505 |
Source: Public Records
Tax History Compared to Growth
Tax History
| Year | Tax Paid | Tax Assessment Tax Assessment Total Assessment is a certain percentage of the fair market value that is determined by local assessors to be the total taxable value of land and additions on the property. | Land | Improvement |
|---|---|---|---|---|
| 2024 | $4,228 | $67,951 | $11,034 | $56,917 |
| 2023 | $5,122 | $60,837 | $9,879 | $50,958 |
| 2022 | $5,122 | $63,390 | $8,347 | $55,043 |
| 2021 | $4,411 | $53,313 | $7,333 | $45,980 |
| 2020 | $4,383 | $49,668 | $6,832 | $42,836 |
| 2019 | $4,315 | $45,512 | $6,260 | $39,252 |
| 2018 | $3,744 | $40,653 | $7,977 | $32,676 |
| 2017 | $3,551 | $35,966 | $7,057 | $28,909 |
| 2016 | $3,130 | $31,253 | $6,132 | $25,121 |
| 2015 | $2,867 | $27,972 | $5,488 | $22,484 |
| 2014 | $2,624 | $25,661 | $5,431 | $20,230 |
| 2012 | $3,812 | $27,802 | $5,884 | $21,918 |
Source: Public Records
Map
Nearby Homes
- 1005 N Lewis Ave
- 1023 N Elmwood Ave
- 12787 W Grove Ave
- 1038 Indiana Ave
- 1117 Judge Ave
- 1213 Grand Ave
- 12352 W Atlantic Ave
- 2009 Harding Ave
- 2008 Harding Ave
- 1504 W Glen Flora Ave
- 615 Tiffany Dr
- 824 N Butrick St
- 1000 Pine St
- 2207 Williamsburg Dr
- 1105 Woodlawn Cir
- 2813 Theresa Ave
- 1312 N Linden Ave
- 1109 Massena Ave
- 917 N Linden Ave
- 2810 W Atlantic Ave
- 1101 Muirfield Ave
- 1035 Muirfield Ave
- 1105 Muirfield Ave
- 1031 Muirfield Ave
- 1032 Westmoreland Ave
- 1109 Muirfield Ave
- 1036 Westmoreland Ave
- 1100 Westmoreland Ave
- 1022 Westmoreland Ave
- 1023 Muirfield Ave
- 1113 Muirfield Ave
- 1110 Westmoreland Ave
- 1018 Westmoreland Ave
- 1038 Muirfield Ave
- 1102 Muirfield Ave
- 1034 Muirfield Ave
- 1106 Muirfield Ave
- 1030 Muirfield Ave
- 1014 Westmoreland Ave
- 1114 Westmoreland Ave