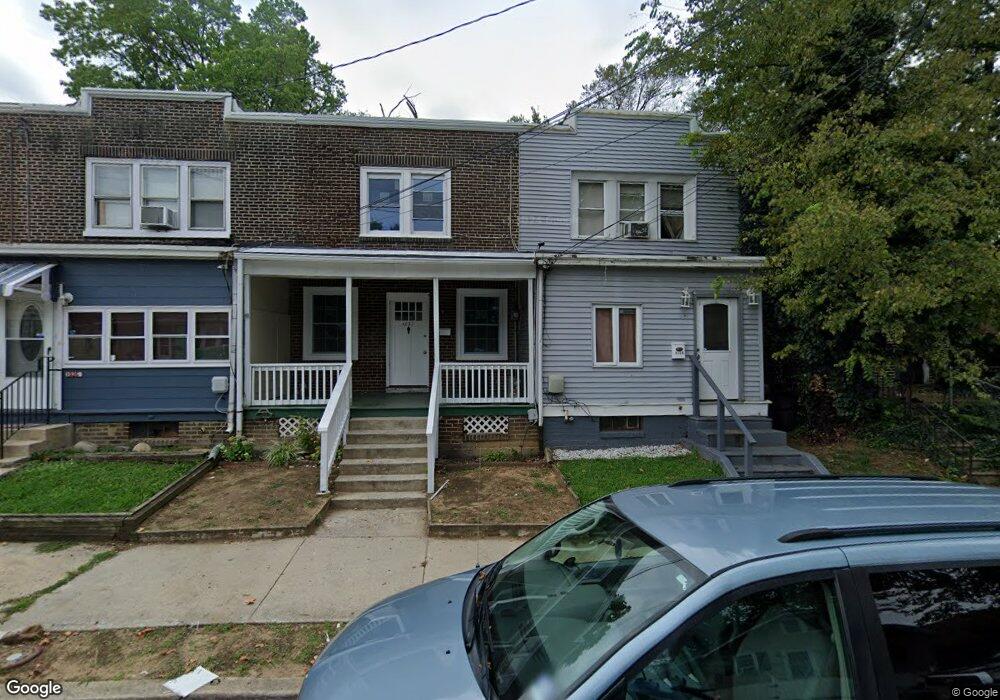
1039 N 35th St Camden, NJ 08105
Cramer Hill NeighborhoodEstimated Value: $150,000 - $188,000
3
Beds
1
Bath
1,080
Sq Ft
$159/Sq Ft
Est. Value
About This Home
This home is located at 1039 N 35th St, Camden, NJ 08105 and is currently estimated at $171,503, approximately $158 per square foot. 1039 N 35th St is a home located in Camden County with nearby schools including Eastside High School, Camdens Promise Charter School, and Urban Promise Academy.
Ownership History
Date
Name
Owned For
Owner Type
Purchase Details
Closed on
Aug 10, 2010
Sold by
Alicea Daniel and Rodriguez Aracely
Bought by
Rodriguez Aracely
Current Estimated Value
Purchase Details
Closed on
May 1, 2001
Sold by
Emc Mtg Corp
Bought by
Alicea Daniel and Alicea Aracely
Purchase Details
Closed on
Nov 25, 1997
Sold by
Buchanan Gregory J
Bought by
Mills Corrine
Home Financials for this Owner
Home Financials are based on the most recent Mortgage that was taken out on this home.
Original Mortgage
$31,000
Interest Rate
7.14%
Create a Home Valuation Report for This Property
The Home Valuation Report is an in-depth analysis detailing your home's value as well as a comparison with similar homes in the area
Home Values in the Area
Average Home Value in this Area
Purchase History
| Date | Buyer | Sale Price | Title Company |
|---|---|---|---|
| Rodriguez Aracely | -- | -- | |
| Alicea Daniel | $19,000 | -- | |
| Alicea Daniel | $19,000 | -- | |
| Mills Corrine | $32,500 | -- |
Source: Public Records
Mortgage History
| Date | Status | Borrower | Loan Amount |
|---|---|---|---|
| Previous Owner | Mills Corrine | $31,000 |
Source: Public Records
Tax History Compared to Growth
Tax History
| Year | Tax Paid | Tax Assessment Tax Assessment Total Assessment is a certain percentage of the fair market value that is determined by local assessors to be the total taxable value of land and additions on the property. | Land | Improvement |
|---|---|---|---|---|
| 2025 | $2,367 | $66,800 | $21,600 | $45,200 |
| 2024 | $2,288 | $66,800 | $21,600 | $45,200 |
| 2023 | $2,288 | $66,800 | $21,600 | $45,200 |
| 2022 | $2,245 | $66,800 | $21,600 | $45,200 |
| 2021 | $2,237 | $66,800 | $21,600 | $45,200 |
| 2020 | $2,124 | $66,800 | $21,600 | $45,200 |
| 2019 | $2,034 | $66,800 | $21,600 | $45,200 |
| 2018 | $2,023 | $66,800 | $21,600 | $45,200 |
| 2017 | $1,974 | $66,800 | $21,600 | $45,200 |
| 2016 | $1,911 | $66,800 | $21,600 | $45,200 |
| 2015 | $1,840 | $66,800 | $21,600 | $45,200 |
| 2014 | $1,796 | $66,800 | $21,600 | $45,200 |
Source: Public Records
Map
Nearby Homes
- 3265 River Ave
- 948 Bergen Ave
- 930 N 32nd St
- 900 Beideman Ave
- 3068 River Rd
- 1027 Lois Ave
- 1408 Hillside Terrace
- 2849 Arthur Ave
- 2805 Polk Ave
- 2816 Pleasant St
- 1744 43rd St
- 1722 44th St
- 2738 Lincoln Ave
- 2830 Cleveland Ave
- 2818 Cleveland Ave
- 420 N 36th St
- 1715 47th St
- 1824 44th St
- 2714 Arthur Ave
- 818 N 27th St