Estimated Value: $165,792 - $194,000
4
Beds
2
Baths
1,800
Sq Ft
$102/Sq Ft
Est. Value
About This Home
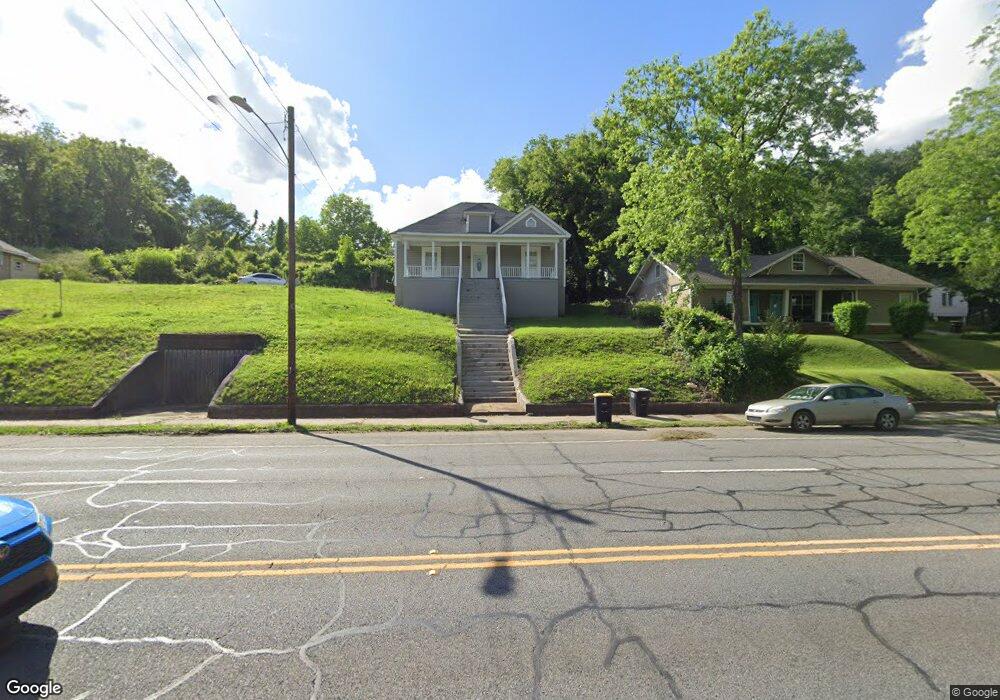
This home is located at 1039 N Broad St NE, Rome, GA 30161 and is currently estimated at $184,448, approximately $102 per square foot. 1039 N Broad St NE is a home located in Floyd County with nearby schools including Dan McCarty Middle School, Rome High School, and St. Mary School.
Ownership History
Date
Name
Owned For
Owner Type
Purchase Details
Closed on
Dec 19, 2012
Sold by
Greater Rome Bank
Bought by
Rayburn Gregory D
Current Estimated Value
Purchase Details
Closed on
Sep 15, 2012
Sold by
Rivera Jose
Bought by
Greater Rome Bank
Purchase Details
Closed on
Sep 23, 2005
Sold by
Youngblood E B
Bought by
Rivera Jose and Rivera Luis Aparicio
Purchase Details
Closed on
Aug 17, 1999
Sold by
Ward Carlos M and Ward Kathryn K
Bought by
Youngblood E B
Purchase Details
Closed on
May 18, 1984
Sold by
N C B & Louise K Houser Co Exec John W H
Bought by
Ward Carlos M and Ward Kathryn K
Purchase Details
Closed on
Jan 1, 1981
Sold by
Houser John W Jr Dr
Bought by
N C B & Louise K Houser Co Exec John W H
Purchase Details
Closed on
Apr 18, 1980
Sold by
Morgan Jackson D
Bought by
Houser John W Jr Dr
Purchase Details
Closed on
May 20, 1977
Sold by
Cowan Wayne F and Cowan Glenda F
Bought by
Morgan Jackson D
Purchase Details
Closed on
Jun 14, 1972
Sold by
Shaw George W
Bought by
Cowan Wayne F and Cowan Glenda F
Purchase Details
Closed on
Jan 1, 1962
Sold by
Shaw Louise
Bought by
Shaw George W
Purchase Details
Closed on
Jan 1, 1901
Sold by
Ward Carlos M and Ward Kathryn K
Bought by
Shaw Louise
Create a Home Valuation Report for This Property
The Home Valuation Report is an in-depth analysis detailing your home's value as well as a comparison with similar homes in the area
Home Values in the Area
Average Home Value in this Area
Purchase History
| Date | Buyer | Sale Price | Title Company |
|---|---|---|---|
| Rayburn Gregory D | $5,600 | -- | |
| Greater Rome Bank | $102,013 | -- | |
| Rivera Jose | $57,600 | -- | |
| Youngblood E B | -- | -- | |
| Ward Carlos M | -- | -- | |
| N C B & Louise K Houser Co Exec John W H | -- | -- | |
| Houser John W Jr Dr | $24,900 | -- | |
| Morgan Jackson D | $5,500 | -- | |
| Cowan Wayne F | $5,100 | -- | |
| Shaw George W | -- | -- | |
| Shaw Louise | -- | -- |
Source: Public Records
Tax History Compared to Growth
Tax History
| Year | Tax Paid | Tax Assessment Tax Assessment Total Assessment is a certain percentage of the fair market value that is determined by local assessors to be the total taxable value of land and additions on the property. | Land | Improvement |
|---|---|---|---|---|
| 2024 | $1,971 | $51,406 | $5,334 | $46,072 |
| 2023 | $1,820 | $49,548 | $4,706 | $44,842 |
| 2022 | $1,040 | $28,493 | $3,765 | $24,728 |
| 2021 | $873 | $23,534 | $3,765 | $19,769 |
| 2020 | $809 | $21,634 | $2,824 | $18,810 |
| 2019 | $763 | $20,614 | $2,824 | $17,790 |
| 2018 | $724 | $19,563 | $2,824 | $16,739 |
| 2017 | $705 | $19,029 | $2,824 | $16,205 |
| 2016 | $694 | $18,680 | $2,800 | $15,880 |
| 2015 | $79 | $19,044 | $2,800 | $16,244 |
| 2014 | $79 | $19,044 | $2,800 | $16,244 |
Source: Public Records
Map
Nearby Homes
- 13 Heard St NE
- 1208 N Broad St NE
- 15 Heard St
- 303 Grady Ave NE
- 31 Ross St NE
- 106 Ross St NE
- 110 Smith St NE
- 102 Smith St NE
- 3 Forsyth St NE
- 163 Sweet Water Lane Dr SE
- 1 Wright St NE
- 117 Jackson St NE
- 119 Jackson St NE
- 325 Ross St NE
- 311 Chambers St NE
- 302 W Callahan St NE
- 3 Roseway Cir NE
- 0 Washington Dr SE Unit 10660409
- 105 E Callahan St NE
- 5 Roseway Cir NE
- 1041 N Broad St NE
- 1037 N Broad St NE
- 7 Duke St NE
- 1035 N Broad St NE
- 2 Heard St NE
- 4 Heard St NE
- 4 Heard St NE
- 9 Duke St NE
- 1033 N Broad St NE
- 11 Duke St NE
- 1031 N Broad St NE
- 8 Duke St NE
- 5 Heard St NE
- 0 Heard St NE Unit 7117707
- 0 Heard St NE Unit 10093522
- 0 Heard St NE
- 7 Heard St NE
- 1029 N Broad St NE
- 10 Duke St NE
- 12 Duke St NE