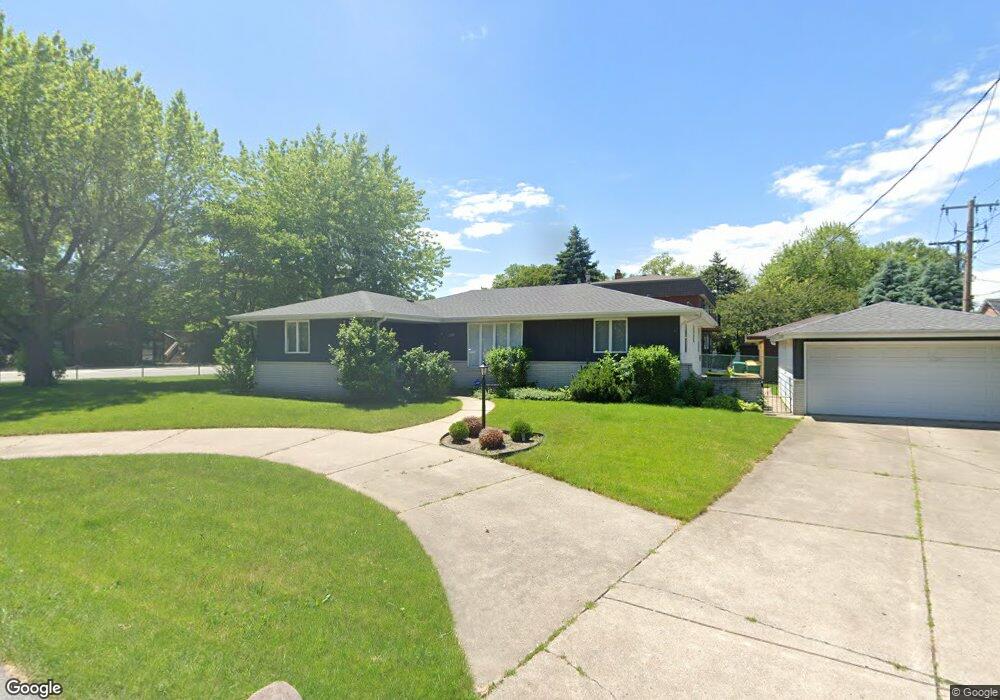
1039 Ridge Rd Munster, IN 46321
Estimated Value: $202,000 - $399,000
1
Bed
1
Bath
1,232
Sq Ft
$232/Sq Ft
Est. Value
About This Home
This home is located at 1039 Ridge Rd, Munster, IN 46321 and is currently estimated at $285,277, approximately $231 per square foot. 1039 Ridge Rd is a home located in Lake County with nearby schools including Munster High School, St. Thomas More School, and Lansing Christian School.
Ownership History
Date
Name
Owned For
Owner Type
Purchase Details
Closed on
Dec 2, 2025
Sold by
City Lights Development Llc and Citylight Development Llc
Bought by
Heuer William
Current Estimated Value
Home Financials for this Owner
Home Financials are based on the most recent Mortgage that was taken out on this home.
Original Mortgage
$307,500
Outstanding Balance
$307,205
Interest Rate
6.19%
Mortgage Type
New Conventional
Estimated Equity
-$21,928
Purchase Details
Closed on
Dec 14, 2020
Sold by
Milan Steve R and Milan Melanie S
Bought by
Citylight Development Llc
Purchase Details
Closed on
Dec 7, 2020
Sold by
Milin Steve R and Milin Melanie S
Bought by
Ciry Light Development Llc
Purchase Details
Closed on
May 14, 2018
Sold by
Milan Melanie S
Bought by
Milan Steve R and Milan Melanie S
Purchase Details
Closed on
Feb 22, 2018
Sold by
Milin Melaine S
Bought by
Smith Melaine S
Create a Home Valuation Report for This Property
The Home Valuation Report is an in-depth analysis detailing your home's value as well as a comparison with similar homes in the area
Home Values in the Area
Average Home Value in this Area
Purchase History
| Date | Buyer | Sale Price | Title Company |
|---|---|---|---|
| Heuer William | -- | Meridian Title | |
| Citylight Development Llc | -- | Chicago Title | |
| Ciry Light Development Llc | -- | Chicago Title Insurance Co | |
| Milan Steve R | -- | None Available | |
| Smith Melaine S | -- | None Available | |
| Milin Melanie S | -- | None Available |
Source: Public Records
Mortgage History
| Date | Status | Borrower | Loan Amount |
|---|---|---|---|
| Open | Heuer William | $307,500 |
Source: Public Records
Tax History
| Year | Tax Paid | Tax Assessment Tax Assessment Total Assessment is a certain percentage of the fair market value that is determined by local assessors to be the total taxable value of land and additions on the property. | Land | Improvement |
|---|---|---|---|---|
| 2025 | $3,167 | $134,900 | $30,800 | $104,100 |
| 2024 | $3,684 | $125,900 | $30,800 | $95,100 |
| 2023 | $2,973 | $120,500 | $34,800 | $85,700 |
| 2022 | $2,973 | $114,300 | $34,800 | $79,500 |
| 2021 | $2,626 | $100,600 | $21,800 | $78,800 |
| 2020 | $2,552 | $97,500 | $21,800 | $75,700 |
| 2019 | $2,385 | $91,800 | $21,800 | $70,000 |
| 2018 | $818 | $88,500 | $21,800 | $66,700 |
| 2017 | $796 | $86,500 | $21,800 | $64,700 |
| 2016 | $711 | $83,000 | $21,800 | $61,200 |
| 2014 | $553 | $77,700 | $21,800 | $55,900 |
| 2013 | $576 | $79,600 | $21,800 | $57,800 |
Source: Public Records
Map
Nearby Homes
- 8342 Howard Ave
- 8318 Howard Ave
- 8226 Kooy Dr
- 910 Ridge Rd Unit 405
- 8412 Greenwood Ave
- 8035 Kooy Dr
- 8639 Linden Ave
- 643 South St Unit 204
- 8224 Beech Ave
- 8306 Walnut Dr
- 8304 Monroe Ave
- 8017 Madison Ave
- 8435 Van Buren Ct
- 1246 River Dr
- 8036 Beech Ave
- 7933 Jefferson Ave Unit 4B
- 8440 Van Buren Ct
- 8423 Harrison Ave
- 8322 Harrison Ave
- 8201 Castle Dr
Your Personal Tour Guide
Ask me questions while you tour the home.