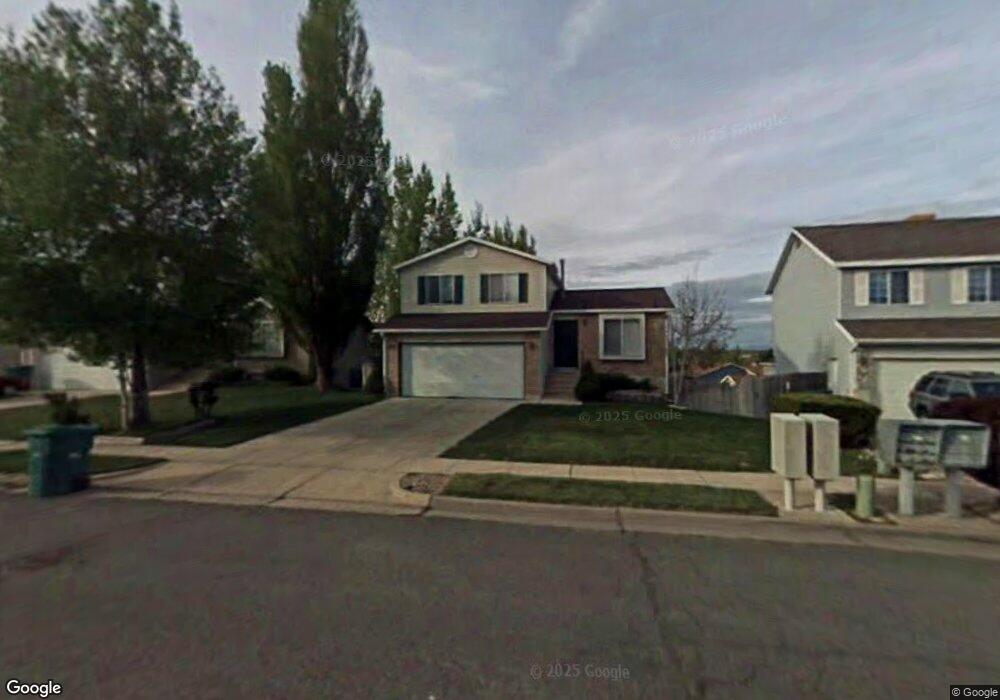
1039 W 2600 N Layton, UT 84041
Estimated Value: $448,000 - $454,000
3
Beds
2
Baths
1,700
Sq Ft
$266/Sq Ft
Est. Value
About This Home
This home is located at 1039 W 2600 N, Layton, UT 84041 and is currently estimated at $451,811, approximately $265 per square foot. 1039 W 2600 N is a home located in Davis County with nearby schools including Lincoln Elementary School, North Layton Junior High School, and Northridge High School.
Ownership History
Date
Name
Owned For
Owner Type
Purchase Details
Closed on
Jan 3, 2022
Sold by
Henry Raymond J
Bought by
Henry Gwen and Tongoi Natalie G
Current Estimated Value
Purchase Details
Closed on
Dec 14, 1999
Sold by
Wade Michael A
Bought by
Henry Raymond James
Home Financials for this Owner
Home Financials are based on the most recent Mortgage that was taken out on this home.
Original Mortgage
$122,000
Interest Rate
7.82%
Mortgage Type
VA
Purchase Details
Closed on
Aug 30, 1996
Sold by
Geyser Frederick Paul
Bought by
Wade Michael A
Home Financials for this Owner
Home Financials are based on the most recent Mortgage that was taken out on this home.
Original Mortgage
$120,462
Interest Rate
8.2%
Mortgage Type
VA
Create a Home Valuation Report for This Property
The Home Valuation Report is an in-depth analysis detailing your home's value as well as a comparison with similar homes in the area
Home Values in the Area
Average Home Value in this Area
Purchase History
| Date | Buyer | Sale Price | Title Company |
|---|---|---|---|
| Henry Gwen | -- | None Listed On Document | |
| Henry Gwen | -- | None Available | |
| Henry Raymond James | -- | Founders Title Co | |
| Wade Michael A | -- | Backman Stewart Title Servic |
Source: Public Records
Mortgage History
| Date | Status | Borrower | Loan Amount |
|---|---|---|---|
| Previous Owner | Henry Raymond James | $122,000 | |
| Previous Owner | Wade Michael A | $120,462 |
Source: Public Records
Tax History Compared to Growth
Tax History
| Year | Tax Paid | Tax Assessment Tax Assessment Total Assessment is a certain percentage of the fair market value that is determined by local assessors to be the total taxable value of land and additions on the property. | Land | Improvement |
|---|---|---|---|---|
| 2024 | $1,914 | $202,399 | $115,664 | $86,735 |
| 2023 | $1,910 | $195,800 | $76,509 | $119,290 |
| 2022 | $1,967 | $362,000 | $132,856 | $229,144 |
| 2021 | $3,252 | $270,000 | $101,243 | $168,757 |
| 2020 | $2,913 | $232,000 | $85,715 | $146,285 |
| 2019 | $1,600 | $227,000 | $81,892 | $145,108 |
| 2018 | $1,440 | $205,000 | $81,892 | $123,108 |
| 2016 | $1,283 | $94,215 | $25,821 | $68,394 |
| 2015 | $1,215 | $84,700 | $25,821 | $58,879 |
| 2014 | $1,251 | $89,184 | $25,821 | $63,363 |
| 2013 | -- | $84,286 | $20,680 | $63,606 |
Source: Public Records
Map
Nearby Homes
- 2402 N 725 W
- 2887 N 1175 W
- 2378 N 675 W
- 2949 N 1175 W
- 781 W 2150 N
- 850 S 1650 E Unit D
- 709 W Highway 193
- 1548 E 925 S
- 2211 N 525 W
- 2875 N Hill Field Rd Unit 58
- 2875 N Hill Field Rd Unit 17
- 2875 N Hill Field Rd Unit 62
- 2187 N 450 W
- 65 Sunset Dr
- 63 Sunset Dr
- 1606 W 1960 N
- 86 Atherton Way
- 121 Barrington Way
- 85 Atherton Way
- 129 Barrington Way