Estimated Value: $209,456 - $260,000
--
Bed
2
Baths
1,667
Sq Ft
$139/Sq Ft
Est. Value
About This Home
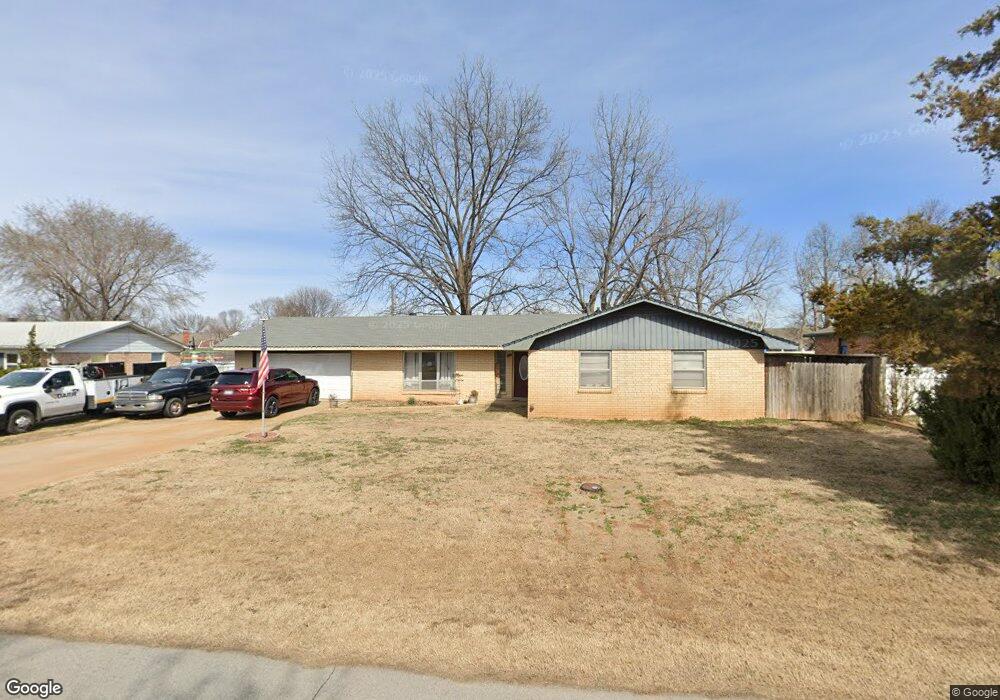
This home is located at 1039 W F St, Jenks, OK 74037 and is currently estimated at $231,364, approximately $138 per square foot. 1039 W F St is a home located in Tulsa County with nearby schools including Jenks West Elementary School, Jenks West Intermediate Elementary School, and Jenks Middle School.
Ownership History
Date
Name
Owned For
Owner Type
Purchase Details
Closed on
May 18, 2015
Sold by
Acker Shirley J and Shirley J Acker 2003 Trust
Bought by
Magee Devon and Adair Michele L
Current Estimated Value
Home Financials for this Owner
Home Financials are based on the most recent Mortgage that was taken out on this home.
Original Mortgage
$66,990
Outstanding Balance
$51,607
Interest Rate
3.68%
Mortgage Type
FHA
Estimated Equity
$179,757
Purchase Details
Closed on
Feb 26, 2003
Sold by
Acker O L and Acker Shirley J
Bought by
Acker Shirley J and Acker Acher O
Create a Home Valuation Report for This Property
The Home Valuation Report is an in-depth analysis detailing your home's value as well as a comparison with similar homes in the area
Home Values in the Area
Average Home Value in this Area
Purchase History
| Date | Buyer | Sale Price | Title Company |
|---|---|---|---|
| Magee Devon | $90,000 | Multiple | |
| Acker Shirley J | -- | -- |
Source: Public Records
Mortgage History
| Date | Status | Borrower | Loan Amount |
|---|---|---|---|
| Open | Magee Devon | $66,990 |
Source: Public Records
Tax History Compared to Growth
Tax History
| Year | Tax Paid | Tax Assessment Tax Assessment Total Assessment is a certain percentage of the fair market value that is determined by local assessors to be the total taxable value of land and additions on the property. | Land | Improvement |
|---|---|---|---|---|
| 2024 | $1,291 | $10,477 | $1,150 | $9,327 |
| 2023 | $1,291 | $11,143 | $1,179 | $9,964 |
| 2022 | $1,262 | $9,818 | $2,236 | $7,582 |
| 2021 | $1,237 | $9,503 | $2,164 | $7,339 |
| 2020 | $1,171 | $9,197 | $2,095 | $7,102 |
| 2019 | $1,141 | $8,900 | $2,027 | $6,873 |
| 2018 | $1,149 | $8,900 | $2,027 | $6,873 |
| 2017 | $1,130 | $9,900 | $2,255 | $7,645 |
| 2016 | $1,158 | $9,900 | $2,255 | $7,645 |
| 2015 | $1,079 | $8,140 | $2,255 | $5,885 |
| 2014 | $1,104 | $8,140 | $2,255 | $5,885 |
Source: Public Records
Map
Nearby Homes