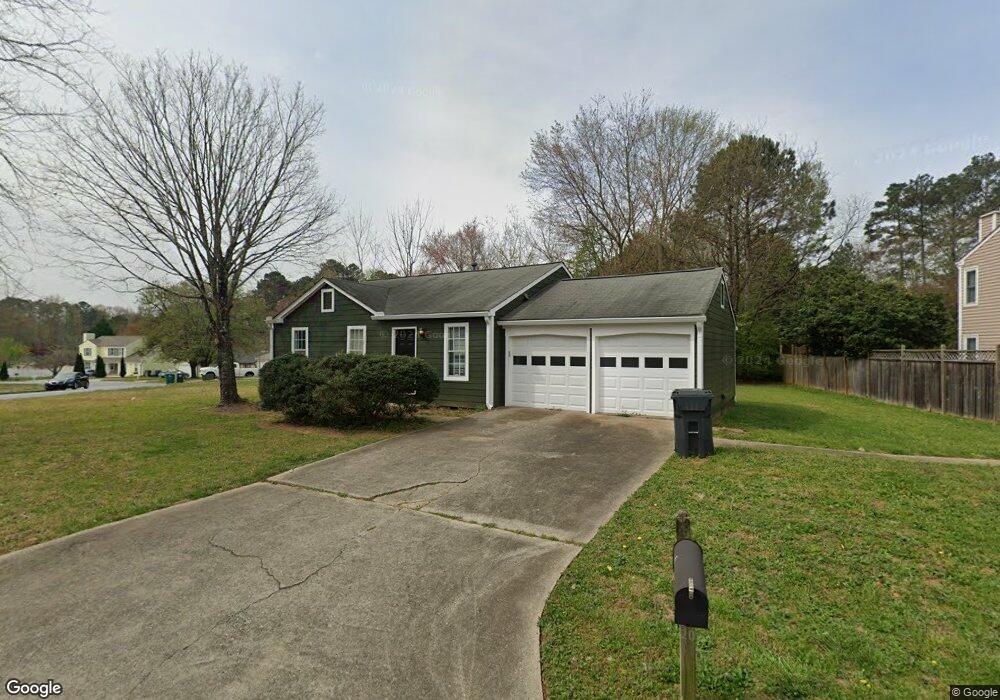
10390 Plantation Bridge Dr Unit 2 Alpharetta, GA 30022
Estimated Value: $357,933 - $364,000
3
Beds
2
Baths
960
Sq Ft
$377/Sq Ft
Est. Value
About This Home
This home is located at 10390 Plantation Bridge Dr Unit 2, Alpharetta, GA 30022 and is currently estimated at $361,483, approximately $376 per square foot. 10390 Plantation Bridge Dr Unit 2 is a home located in Fulton County with nearby schools including Dolvin Elementary School, Autrey Mill Middle School, and Johns Creek High School.
Ownership History
Date
Name
Owned For
Owner Type
Purchase Details
Closed on
Dec 11, 2002
Sold by
Reid C Fredric
Bought by
Keyes James
Current Estimated Value
Home Financials for this Owner
Home Financials are based on the most recent Mortgage that was taken out on this home.
Original Mortgage
$137,700
Outstanding Balance
$62,805
Interest Rate
5.92%
Mortgage Type
VA
Estimated Equity
$298,678
Purchase Details
Closed on
Apr 15, 2002
Sold by
Bidwell Michael J
Bought by
Reid C Frederic
Home Financials for this Owner
Home Financials are based on the most recent Mortgage that was taken out on this home.
Original Mortgage
$91,800
Interest Rate
6.89%
Mortgage Type
New Conventional
Purchase Details
Closed on
Aug 4, 1997
Sold by
Jones Tracy J and Jones Diana A
Bought by
Bidwell Michael J
Home Financials for this Owner
Home Financials are based on the most recent Mortgage that was taken out on this home.
Original Mortgage
$86,450
Interest Rate
7.65%
Mortgage Type
New Conventional
Create a Home Valuation Report for This Property
The Home Valuation Report is an in-depth analysis detailing your home's value as well as a comparison with similar homes in the area
Home Values in the Area
Average Home Value in this Area
Purchase History
| Date | Buyer | Sale Price | Title Company |
|---|---|---|---|
| Keyes James | $135,000 | -- | |
| Reid C Frederic | $102,000 | -- | |
| Bidwell Michael J | $91,000 | -- |
Source: Public Records
Mortgage History
| Date | Status | Borrower | Loan Amount |
|---|---|---|---|
| Open | Keyes James | $137,700 | |
| Previous Owner | Reid C Frederic | $91,800 | |
| Previous Owner | Bidwell Michael J | $86,450 |
Source: Public Records
Tax History Compared to Growth
Tax History
| Year | Tax Paid | Tax Assessment Tax Assessment Total Assessment is a certain percentage of the fair market value that is determined by local assessors to be the total taxable value of land and additions on the property. | Land | Improvement |
|---|---|---|---|---|
| 2025 | $3,482 | $116,000 | $32,000 | $84,000 |
| 2023 | $3,555 | $125,960 | $32,000 | $93,960 |
| 2022 | $3,260 | $106,240 | $25,440 | $80,800 |
| 2021 | $2,655 | $84,280 | $18,000 | $66,280 |
| 2020 | $2,298 | $71,400 | $17,560 | $53,840 |
| 2019 | $276 | $70,120 | $17,240 | $52,880 |
| 2018 | $1,974 | $60,600 | $16,160 | $44,440 |
| 2017 | $1,427 | $41,920 | $13,960 | $27,960 |
| 2016 | $1,332 | $39,720 | $13,960 | $25,760 |
| 2015 | $1,347 | $39,720 | $13,960 | $25,760 |
| 2014 | $1,165 | $33,040 | $8,920 | $24,120 |
Source: Public Records
Map
Nearby Homes
- 10415 Plantation Bridge Dr
- 125 Oak Bridge Ct Unit 2
- 130 Colony Run
- 10515 Colony Glen Dr Unit 2
- 10405 Meadow Crest Ln
- 120 Thome Dr
- 710 Country Manor Way
- 10325 Oxford Mill Cir Unit 1
- 115 Thome Dr
- 9925 Lauren Hall Ct
- 415 Wood Trace Ct
- 10050 Lauren Hall Ct
- 235 Wood Shoals Ct
- 510 Winborne Place Unit VI
- 10090 Jones Bridge Rd Unit 8
- 10530 Tuxford Dr
- 11070 Pinewalk Forest Cir
- 285 Rolling Mist Ct
- 350 Waters Bend Way
- 320 Outwood Mill Ct
- 10380 Plantation Bridge Dr Unit 2
- 0 Plantation Glen Ct Unit 7438868
- 0 Plantation Glen Ct Unit 7519341
- 0 Plantation Glen Ct Unit 7146180
- 210 Plantation Glen Ct
- 205 Plantation Glen Ct Unit 2
- 10370 Plantation Bridge Dr
- 215 Plantation Glen Ct
- 220 Plantation Glen Ct
- 10375 Plantation
- 10365 Plantation Bridge Dr
- 10385 Plantation Bridge Dr
- 225 Plantation Glen Ct Unit 2
- 10410 Plantation Bridge Dr
- 10360 Plantation Bridge Dr
- 230 Plantation Glen Ct
- 230 Plantation Glen Ct
- 10355 Plantation Bridge Dr
- 10395 Plantation Bridge Dr Unit 3
- 300 Jenny Lind Ln Unit 5