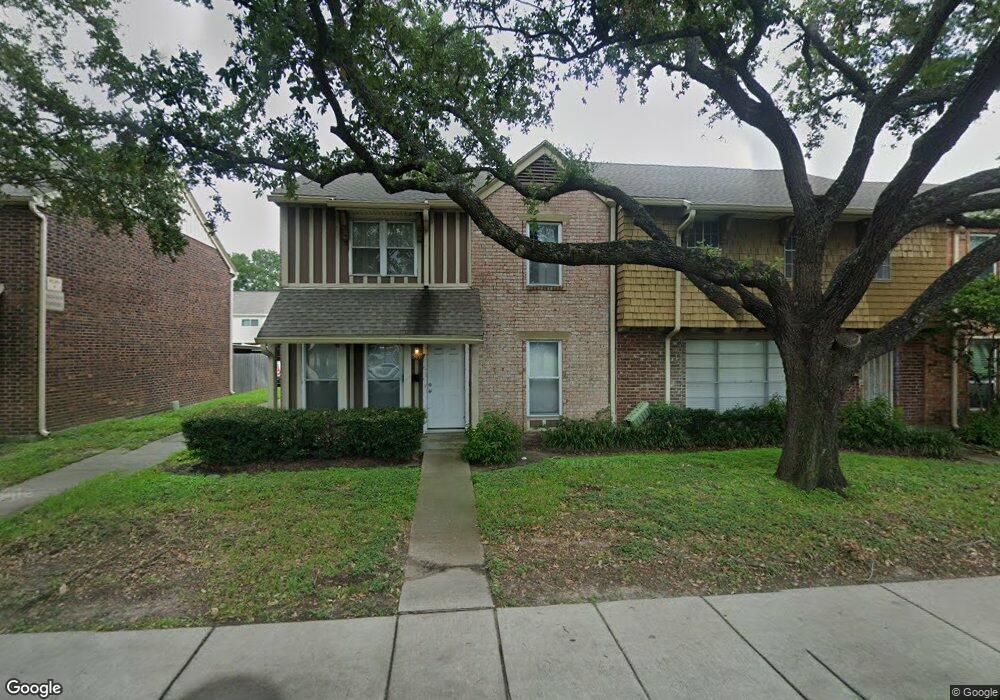
10398 Hammerly Blvd Unit 38 Houston, TX 77043
Spring Shadows NeighborhoodEstimated Value: $193,000 - $203,000
3
Beds
3
Baths
1,716
Sq Ft
$115/Sq Ft
Est. Value
About This Home
This home is located at 10398 Hammerly Blvd Unit 38, Houston, TX 77043 and is currently estimated at $197,826, approximately $115 per square foot. 10398 Hammerly Blvd Unit 38 is a home located in Harris County with nearby schools including Westwood Elementary School, Spring Oaks Middle School, and Spring Woods High School.
Ownership History
Date
Name
Owned For
Owner Type
Purchase Details
Closed on
Mar 26, 2011
Sold by
Gutierrez Nicole and Jones Nicole
Bought by
Gutierrez Nicole
Current Estimated Value
Home Financials for this Owner
Home Financials are based on the most recent Mortgage that was taken out on this home.
Original Mortgage
$72,408
Outstanding Balance
$3,395
Interest Rate
5.04%
Mortgage Type
New Conventional
Estimated Equity
$194,431
Purchase Details
Closed on
Feb 27, 2003
Sold by
Ali Syed M
Bought by
Jones Nicole
Home Financials for this Owner
Home Financials are based on the most recent Mortgage that was taken out on this home.
Original Mortgage
$79,325
Interest Rate
5.86%
Purchase Details
Closed on
Jul 19, 2002
Sold by
Hart Creig A and Hart Seon D
Bought by
Ali Syed M
Home Financials for this Owner
Home Financials are based on the most recent Mortgage that was taken out on this home.
Original Mortgage
$39,000
Interest Rate
6.69%
Create a Home Valuation Report for This Property
The Home Valuation Report is an in-depth analysis detailing your home's value as well as a comparison with similar homes in the area
Home Values in the Area
Average Home Value in this Area
Purchase History
| Date | Buyer | Sale Price | Title Company |
|---|---|---|---|
| Gutierrez Nicole | -- | Ctic | |
| Jones Nicole | -- | -- | |
| Ali Syed M | -- | Chicago Title |
Source: Public Records
Mortgage History
| Date | Status | Borrower | Loan Amount |
|---|---|---|---|
| Open | Gutierrez Nicole | $72,408 | |
| Closed | Jones Nicole | $79,325 | |
| Previous Owner | Ali Syed M | $39,000 |
Source: Public Records
Tax History Compared to Growth
Tax History
| Year | Tax Paid | Tax Assessment Tax Assessment Total Assessment is a certain percentage of the fair market value that is determined by local assessors to be the total taxable value of land and additions on the property. | Land | Improvement |
|---|---|---|---|---|
| 2025 | $2,263 | $191,816 | $57,000 | $134,816 |
| 2024 | $2,263 | $189,393 | $57,000 | $132,393 |
| 2023 | $2,263 | $187,678 | $57,000 | $130,678 |
| 2022 | $4,100 | $170,227 | $57,000 | $113,227 |
| 2021 | $3,733 | $152,890 | $47,500 | $105,390 |
| 2020 | $3,852 | $152,890 | $50,000 | $102,890 |
| 2019 | $3,653 | $147,537 | $40,000 | $107,537 |
| 2018 | $1,196 | $135,861 | $40,000 | $95,861 |
| 2017 | $2,906 | $135,861 | $40,000 | $95,861 |
| 2016 | $2,642 | $135,861 | $40,000 | $95,861 |
| 2015 | $1,568 | $119,624 | $35,000 | $84,624 |
| 2014 | $1,568 | $83,450 | $20,000 | $63,450 |
Source: Public Records
Map
Nearby Homes
- 10382 Hammerly Blvd
- 2342 Triway Ln Unit 147
- 10466 Hammerly Blvd Unit 70
- 10227 Emnora Ln
- 10488 Hammerly Blvd Unit 81
- 2233 Triway Ln Unit 267
- 2219 Triway Ln Unit 240
- 2103 Southwick St
- 10214 Moorberry Ln
- 2252 Shadowdale Dr Unit 362
- 10415 Westray St
- 2212 Shadowdale Dr Unit 358
- 2202 Shadowdale Dr Unit 353
- 10227 Knoboak Dr
- 2603 Durban Dr
- 2106 Teague Rd
- 2102 Teague Rd
- 2535 Southwick St
- 10226 Rothbury St
- 10115 Moorberry Ln
- 10396 Hammerly Blvd Unit 36
- 10394 Hammerly Blvd
- 10428 Hammerly Blvd Unit 51
- 10392 Hammerly Blvd Unit 35
- 10430 Hammerly Blvd Unit 52
- 10390 Hammerly Blvd Unit 34
- 10432 Hammerly Blvd Unit 53
- 10432 Hammerly Blvd
- 10388 Hammerly Blvd Unit 33
- 10388 Hammerly Blvd
- 10414 Hammerly Blvd
- 10412 Hammerly Blvd Unit 43
- 10410 Hammerly Blvd Unit 42
- 10436 Hammerly Blvd Unit 55
- 10408 Hammerly Blvd Unit 41
- 10418 Hammerly Blvd Unit 46
- 10406 Hammerly Blvd Unit 40
- 10438 Hammerly Blvd Unit 56
- 10420 Hammerly Blvd Unit 47
- 10404 Hammerly Blvd Unit 39