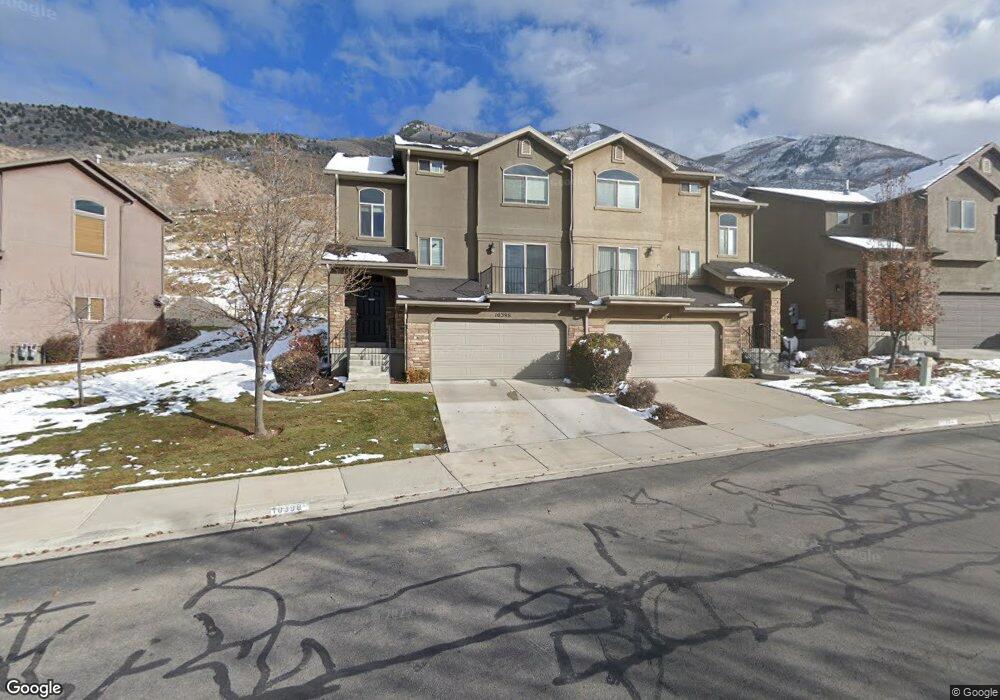
10398 N Morgan Blvd Cedar Hills, UT 84062
Estimated Value: $435,000 - $462,000
3
Beds
3
Baths
1,754
Sq Ft
$255/Sq Ft
Est. Value
About This Home
This home is located at 10398 N Morgan Blvd, Cedar Hills, UT 84062 and is currently estimated at $447,289, approximately $255 per square foot. 10398 N Morgan Blvd is a home located in Utah County with nearby schools including Cedar Ridge Elementary School, Mountain Ridge Junior High School, and American Fork High School.
Ownership History
Date
Name
Owned For
Owner Type
Purchase Details
Closed on
Jan 22, 2018
Sold by
Chalten Capital Llc
Bought by
Torrabai Capital Llc
Current Estimated Value
Purchase Details
Closed on
Apr 18, 2013
Sold by
Morris Mark and Morris Abbey
Bought by
Chalten Capital Llc
Purchase Details
Closed on
Jan 18, 2011
Sold by
Newhard Timothy A and Newhard Cheri M
Bought by
Morris Mark and Morris Abbey
Home Financials for this Owner
Home Financials are based on the most recent Mortgage that was taken out on this home.
Original Mortgage
$145,046
Interest Rate
2.75%
Mortgage Type
FHA
Purchase Details
Closed on
Jun 12, 2008
Sold by
G & J Construction Inc
Bought by
Newhard Timothy A and Newhard Cheri M
Home Financials for this Owner
Home Financials are based on the most recent Mortgage that was taken out on this home.
Original Mortgage
$196,811
Interest Rate
5.99%
Mortgage Type
FHA
Create a Home Valuation Report for This Property
The Home Valuation Report is an in-depth analysis detailing your home's value as well as a comparison with similar homes in the area
Home Values in the Area
Average Home Value in this Area
Purchase History
| Date | Buyer | Sale Price | Title Company |
|---|---|---|---|
| Torrabai Capital Llc | -- | Inwest Title | |
| Chalten Capital Llc | -- | Inwest Title Services Inc | |
| Morris Mark | -- | Integrated Title Insurance | |
| Newhard Timothy A | -- | Affiliated First Title Comp |
Source: Public Records
Mortgage History
| Date | Status | Borrower | Loan Amount |
|---|---|---|---|
| Previous Owner | Morris Mark | $145,046 | |
| Previous Owner | Newhard Timothy A | $196,811 |
Source: Public Records
Tax History Compared to Growth
Tax History
| Year | Tax Paid | Tax Assessment Tax Assessment Total Assessment is a certain percentage of the fair market value that is determined by local assessors to be the total taxable value of land and additions on the property. | Land | Improvement |
|---|---|---|---|---|
| 2025 | $1,878 | $224,015 | $59,900 | $347,400 |
| 2024 | $1,878 | $222,365 | $0 | $0 |
| 2023 | $1,647 | $209,605 | $0 | $0 |
| 2022 | $1,683 | $209,110 | $0 | $0 |
| 2021 | $1,571 | $290,800 | $43,600 | $247,200 |
| 2020 | $1,436 | $259,500 | $38,900 | $220,600 |
| 2019 | $1,360 | $255,100 | $38,300 | $216,800 |
| 2018 | $1,198 | $211,700 | $31,800 | $179,900 |
| 2017 | $1,141 | $107,800 | $0 | $0 |
| 2016 | $1,120 | $98,450 | $0 | $0 |
| 2015 | $1,157 | $96,250 | $0 | $0 |
| 2014 | $1,038 | $85,800 | $0 | $0 |
Source: Public Records
Map
Nearby Homes
- 10448 Sage Vista Ln
- 10468 N Sage Vista Ln
- 10456 N Morgan Blvd
- 10514 N Doral Dr
- 10412 N Bayhill Dr
- 10587 N Avalon St
- 3870 Mountaintop Cir
- 4083 W Hayes Cir
- 10795 N La Costa
- 3851 W Mountaintop Cir Unit 5
- 4084 W Shinnecock
- 4198 W Sage Rd N
- 4292 W Joshua Ln
- 10207 N Cottonwood Dr
- 9900 N Meadow Dr
- 4124 N 810 W
- 9575 Aztec Dr
- 11197 N Park Dr
- 9547 N Canyon Rd
- 9481 N 3830 W
- 10398 Morgan Blvd
- 10394 N Morgan Blvd Unit 402
- 10394 N Morgan Blvd
- 10394 Morgan Blvd
- 10408 Sage Vista Ln
- 10408 Sage Vista Ln Unit 320
- 10392 Morgan Blvd
- 10392 Morgan Blvd Unit 403
- 10414 N Sage Vista Ln Unit 10414
- 10414 N Sage Vista Ln Unit 319
- 10414 N Sage Vista Ln
- 10414 Sage Vista Ln
- 10386 N Morgan Blvd Unit 404
- 10386 N Morgan Blvd
- 10386 N Morgan Blvd
- 10386 N Morgan Blvd Unit 404
- 10416 N Sage Vista Ln Unit 318
- 10416 N Sage Vista Ln
- 10416 N Sage Vista Ln
- 10416 N Sage Vista Ln Unit 318