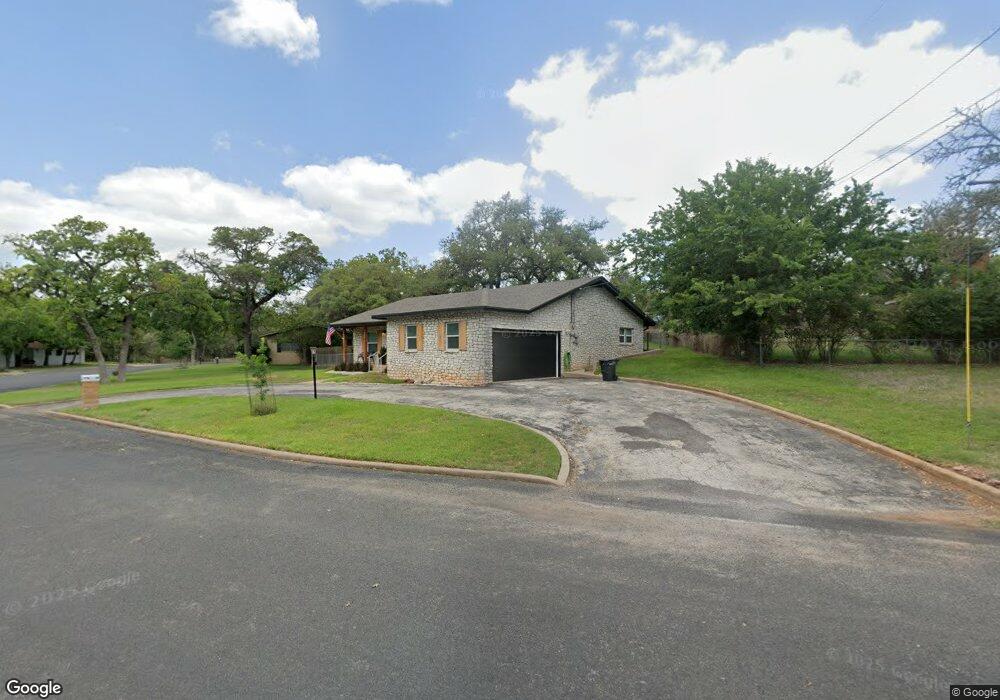
104 104 Glenwood Fredericksburg, TX 78624
Estimated Value: $602,474
3
Beds
2
Baths
1,633
Sq Ft
$369/Sq Ft
Est. Value
About This Home
This home is located at 104 104 Glenwood, Fredericksburg, TX 78624 and is currently estimated at $602,474, approximately $368 per square foot. 104 104 Glenwood is a home located in Gillespie County with nearby schools including Fredericksburg High School, Ambleside School of Fredericksburg, and St. Mary's Catholic School.
Ownership History
Date
Name
Owned For
Owner Type
Purchase Details
Closed on
Mar 4, 2023
Sold by
Btg Designs Llc
Bought by
Coe David James
Current Estimated Value
Purchase Details
Closed on
Dec 13, 2021
Sold by
Robinson William J and Robinson Adrianne
Bought by
Btg Designs Llc
Purchase Details
Closed on
Apr 19, 2017
Sold by
Harris Stephen F
Bought by
Robinson William J and Robinson Adrienne
Home Financials for this Owner
Home Financials are based on the most recent Mortgage that was taken out on this home.
Original Mortgage
$232,425
Interest Rate
4.21%
Mortgage Type
VA
Purchase Details
Closed on
Oct 20, 2015
Sold by
Harris Stephen F
Bought by
Harris Stephen F
Create a Home Valuation Report for This Property
The Home Valuation Report is an in-depth analysis detailing your home's value as well as a comparison with similar homes in the area
Home Values in the Area
Average Home Value in this Area
Purchase History
| Date | Buyer | Sale Price | Title Company |
|---|---|---|---|
| Coe David James | -- | None Listed On Document | |
| Btg Designs Llc | -- | None Available | |
| Robinson William J | -- | None Available | |
| Harris Stephen F | -- | None Available |
Source: Public Records
Mortgage History
| Date | Status | Borrower | Loan Amount |
|---|---|---|---|
| Previous Owner | Robinson William J | $232,425 | |
| Closed | Btg Designs Llc | $0 |
Source: Public Records
Tax History Compared to Growth
Tax History
| Year | Tax Paid | Tax Assessment Tax Assessment Total Assessment is a certain percentage of the fair market value that is determined by local assessors to be the total taxable value of land and additions on the property. | Land | Improvement |
|---|---|---|---|---|
| 2025 | $7,648 | $610,900 | $161,150 | $449,750 |
| 2024 | $7,648 | $610,900 | $161,150 | $449,750 |
| 2023 | $7,484 | $610,900 | $161,150 | $449,750 |
| 2022 | $5,539 | $370,640 | $140,110 | $230,530 |
| 2021 | $4,293 | $272,160 | $72,930 | $199,230 |
| 2020 | $3,985 | $231,360 | $63,110 | $168,250 |
| 2019 | $4,063 | $227,400 | $63,110 | $164,290 |
| 2018 | $3,994 | $224,480 | $63,110 | $161,370 |
| 2017 | $3,975 | $217,430 | $63,110 | $154,320 |
| 2016 | $3,461 | $189,290 | $54,420 | $134,870 |
| 2015 | -- | $181,790 | $54,420 | $127,370 |
| 2014 | -- | $170,140 | $47,690 | $122,450 |
Source: Public Records
Map
Nearby Homes
- 125 Stone Canyon
- 127 Stone Canyon Unit 394
- 126 Tanglewood Dr
- 126 Ridgewood Dr
- 2009 Woodway Ct
- 2009 Woodway Ct Unit 41
- 202 Tanglewood Dr
- 133 Stone Canyon Unit 392
- 2140 Hedgestone Unit 3
- 108 Tanglewood Dr
- 124 Frederick Rd
- 2157 Stone Oak
- 205 Crestwood Dr
- 2023 Briarwood Cir
- 302 Frederick Rd
- 2158 Hedgestone
- 107 W Driftwood Dr
- 123 Stone Forest Unit 395
- 1826 Quailwood Dr
- 205 Edgewood Dr
- 104 Glenwood Dr
- 106 Glenwood Dr
- 119 Ridgewood Dr
- 103 Glenwood Dr
- 105 Glenwood Dr
- 108 Glenwood Dr
- 101 Glenwood Dr
- 107 Glenwood Dr
- 121 Ridgewood Dr
- 109 Glenwood Dr
- 110 Glenwood Dr
- 116 Ridgewood Dr
- 113 Ridgewood Dr
- 118 Ridgewood Dr
- 114 Ridgewood Dr
- 123 Ridgewood Dr
- 122 Tanglewood Dr
- 120 Ridgewood Dr
- 120 Tanglewood Dr
- 118 Tanglewood Dr