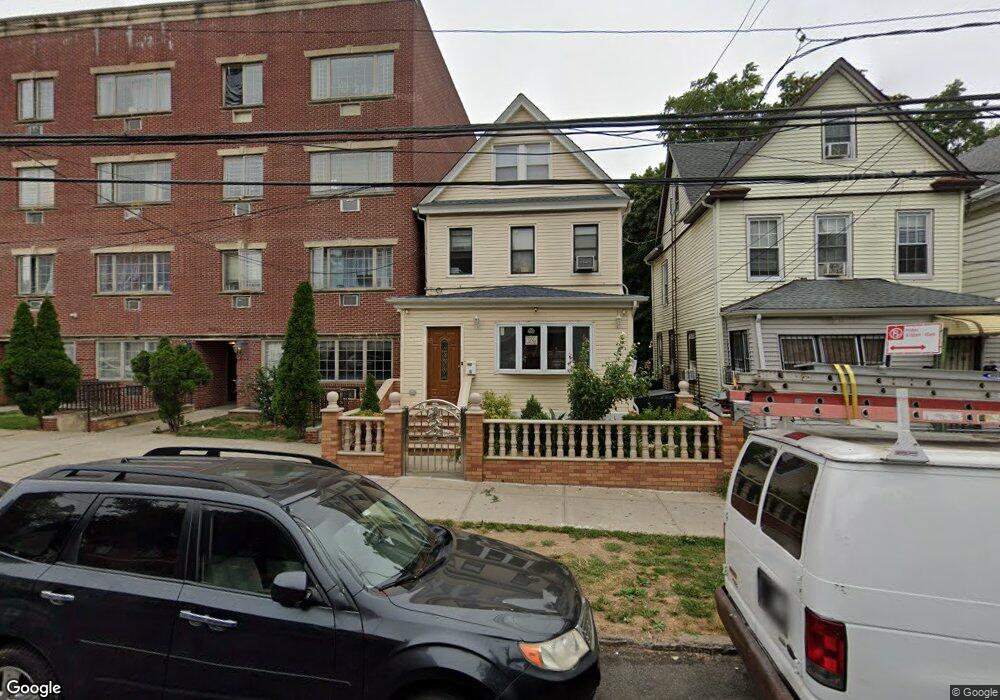
104-18 39th Ave Unit 3 Corona, NY 11368
Corona NeighborhoodEstimated Value: $978,683 - $1,350,000
1
Bed
1
Bath
1,492
Sq Ft
$795/Sq Ft
Est. Value
About This Home
This home is located at 104-18 39th Ave Unit 3, Corona, NY 11368 and is currently estimated at $1,186,171, approximately $795 per square foot. 104-18 39th Ave Unit 3 is a home located in Queens County with nearby schools including P.S. 16 the Nancy Debenedittis School, Is 61 Leonardo Da Vinci, and Flushing High School.
Ownership History
Date
Name
Owned For
Owner Type
Purchase Details
Closed on
Oct 6, 2023
Sold by
Cuzco Bolivia and Salazar Bolivia
Bought by
Cuzco Manny Brian
Current Estimated Value
Purchase Details
Closed on
Nov 30, 2006
Sold by
Cuzco Bolivia and Cuzco Manuel
Bought by
Cuzco Bolivia
Home Financials for this Owner
Home Financials are based on the most recent Mortgage that was taken out on this home.
Original Mortgage
$425,000
Outstanding Balance
$254,098
Interest Rate
6.31%
Mortgage Type
Purchase Money Mortgage
Estimated Equity
$932,073
Purchase Details
Closed on
Jul 25, 1997
Sold by
Alaimo Richard J and Alaimo Domenick
Bought by
Salazar Maria
Home Financials for this Owner
Home Financials are based on the most recent Mortgage that was taken out on this home.
Original Mortgage
$151,750
Interest Rate
7.36%
Mortgage Type
FHA
Create a Home Valuation Report for This Property
The Home Valuation Report is an in-depth analysis detailing your home's value as well as a comparison with similar homes in the area
Home Values in the Area
Average Home Value in this Area
Purchase History
| Date | Buyer | Sale Price | Title Company |
|---|---|---|---|
| Cuzco Manny Brian | -- | -- | |
| Cuzco Manny Brian | -- | -- | |
| Cuzco Bolivia | -- | -- | |
| Cuzco Bolivia | -- | -- | |
| Salazar Maria | $160,000 | -- | |
| Salazar Maria | $160,000 | -- |
Source: Public Records
Mortgage History
| Date | Status | Borrower | Loan Amount |
|---|---|---|---|
| Open | Cuzco Bolivia | $425,000 | |
| Closed | Cuzco Bolivia | $425,000 | |
| Closed | Salazar Maria | $151,750 |
Source: Public Records
Tax History Compared to Growth
Tax History
| Year | Tax Paid | Tax Assessment Tax Assessment Total Assessment is a certain percentage of the fair market value that is determined by local assessors to be the total taxable value of land and additions on the property. | Land | Improvement |
|---|---|---|---|---|
| 2025 | $6,621 | $36,336 | $8,222 | $28,114 |
| 2024 | $6,902 | $34,363 | $9,314 | $25,049 |
| 2023 | $6,276 | $32,645 | $7,853 | $24,792 |
| 2022 | $5,887 | $51,660 | $14,880 | $36,780 |
| 2021 | $6,183 | $49,200 | $14,880 | $34,320 |
| 2020 | $6,113 | $52,920 | $14,880 | $38,040 |
| 2019 | $5,698 | $58,320 | $14,880 | $43,440 |
| 2018 | $5,248 | $27,204 | $7,286 | $19,918 |
| 2017 | $4,954 | $25,772 | $9,469 | $16,303 |
| 2016 | $4,819 | $25,772 | $9,469 | $16,303 |
| 2015 | $2,713 | $25,233 | $12,616 | $12,617 |
| 2014 | $2,713 | $23,864 | $11,698 | $12,166 |
Source: Public Records
Map
Nearby Homes
- 104-12 38th Ave
- 104-21 39th Ave Unit 211C
- 104-32 39th Ave
- 101-20 39th Ave
- 40-29 102nd St
- 104-48 37th Dr Unit 3A
- 104-64 39th Ave Unit 3A
- 100-17 39th Ave
- 3730 103rd St Unit 2
- 3730 103rd St Unit G2
- 104-61 Roosevelt Ave
- 104-68 39th Ave
- 37-30 103rd St Unit 2B
- 37-30 103rd St Unit 2E
- 37-30 103rd St Unit D3
- 37-44 102nd St
- 104-60 Roosevelt Ave
- 100-15 40th Rd
- 104-40 41st Ave
- 37-13 104th St
- 10414 39th Ave
- 10412 39th Ave
- 10418 39th Ave
- 10420 39th Ave
- 10420 39th Ave
- 104-20 39th Ave Unit 1-B
- 104-20 39th Ave
- 3903 104th St
- 3905 104th St
- 104-22 39th Ave
- 104-22 39th Ave Unit 4-B
- 104-22 39th Ave Unit 4-A
- 104-22 39th Ave Unit 3-B
- 104-22 39th Ave Unit 1-A
- 10422 39th Ave
- 3901 104th St
- 3907 104th St
- 39-5 104th St
- 39-05 104th St
- 10424 39th Ave