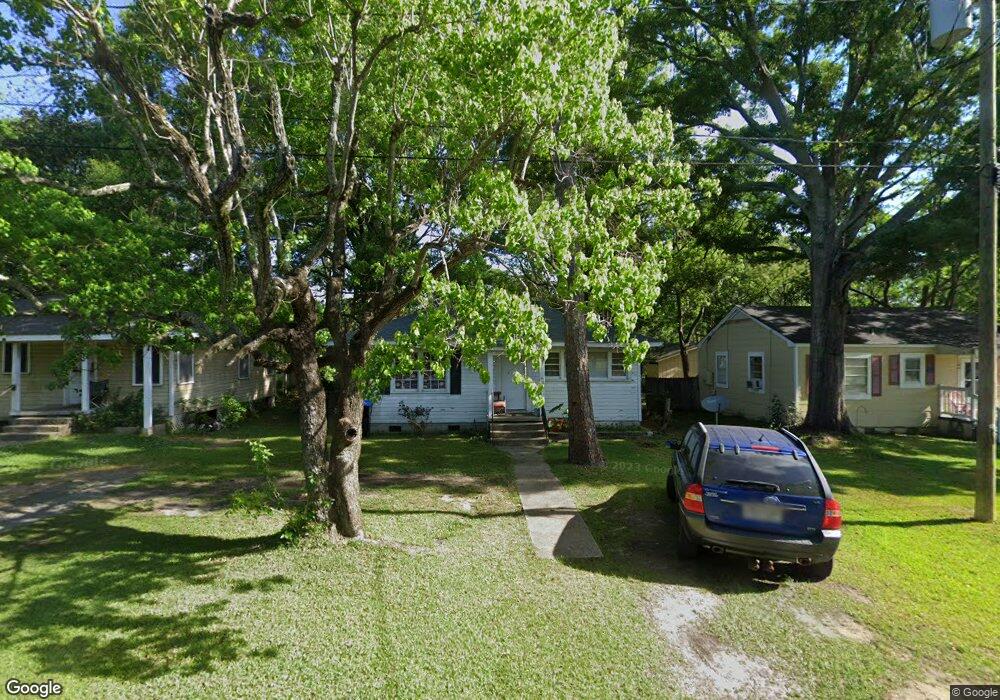
104 9th Ave Mobile, AL 36611
Estimated Value: $40,000 - $76,000
2
Beds
1
Bath
792
Sq Ft
$73/Sq Ft
Est. Value
About This Home
This home is located at 104 9th Ave, Mobile, AL 36611 and is currently estimated at $57,644, approximately $72 per square foot. 104 9th Ave is a home located in Mobile County with nearby schools including Chickasaw City Elementary School, Chickasaw City High School, and Prichard Preparatory School.
Ownership History
Date
Name
Owned For
Owner Type
Purchase Details
Closed on
Nov 10, 2016
Sold by
Mobile County
Bought by
Cents Charles A
Current Estimated Value
Purchase Details
Closed on
May 29, 2012
Sold by
Dearmond Doris E
Bought by
Jordan Homes Llc
Home Financials for this Owner
Home Financials are based on the most recent Mortgage that was taken out on this home.
Original Mortgage
$20,000
Interest Rate
7.5%
Mortgage Type
Seller Take Back
Purchase Details
Closed on
Nov 9, 2010
Sold by
American Real Estate Solutions Llc
Bought by
Dearmond Doris E
Purchase Details
Closed on
Feb 16, 2006
Sold by
Howell Ethelinda B
Bought by
American Real Estate Solutions Llc
Purchase Details
Closed on
Jul 28, 2001
Sold by
Mccormick Betty Lou
Bought by
Howell Ethelinda B
Create a Home Valuation Report for This Property
The Home Valuation Report is an in-depth analysis detailing your home's value as well as a comparison with similar homes in the area
Home Values in the Area
Average Home Value in this Area
Purchase History
| Date | Buyer | Sale Price | Title Company |
|---|---|---|---|
| Cents Charles A | $2,764 | None Available | |
| Jordan Homes Llc | -- | None Available | |
| Dearmond Doris E | -- | None Available | |
| American Real Estate Solutions Llc | -- | None Available | |
| Howell Ethelinda B | -- | -- |
Source: Public Records
Mortgage History
| Date | Status | Borrower | Loan Amount |
|---|---|---|---|
| Previous Owner | Jordan Homes Llc | $20,000 |
Source: Public Records
Tax History
| Year | Tax Paid | Tax Assessment Tax Assessment Total Assessment is a certain percentage of the fair market value that is determined by local assessors to be the total taxable value of land and additions on the property. | Land | Improvement |
|---|---|---|---|---|
| 2025 | -- | $3,050 | $600 | $2,450 |
| 2024 | -- | $5,700 | $1,200 | $4,500 |
| 2023 | $0 | $5,140 | $1,200 | $3,940 |
| 2022 | $0 | $4,780 | $1,200 | $3,580 |
| 2021 | $0 | $4,380 | $1,100 | $3,280 |
| 2020 | $218 | $2,190 | $550 | $1,640 |
| 2019 | $218 | $2,100 | $0 | $0 |
| 2018 | $218 | $4,080 | $0 | $0 |
| 2017 | $0 | $4,080 | $0 | $0 |
| 2016 | -- | $0 | $0 | $0 |
| 2013 | $405 | $7,160 | $0 | $0 |
Source: Public Records
Map
Nearby Homes