Estimated Value: $929,000 - $1,009,543
--
Bed
--
Bath
7,576
Sq Ft
$129/Sq Ft
Est. Value
About This Home
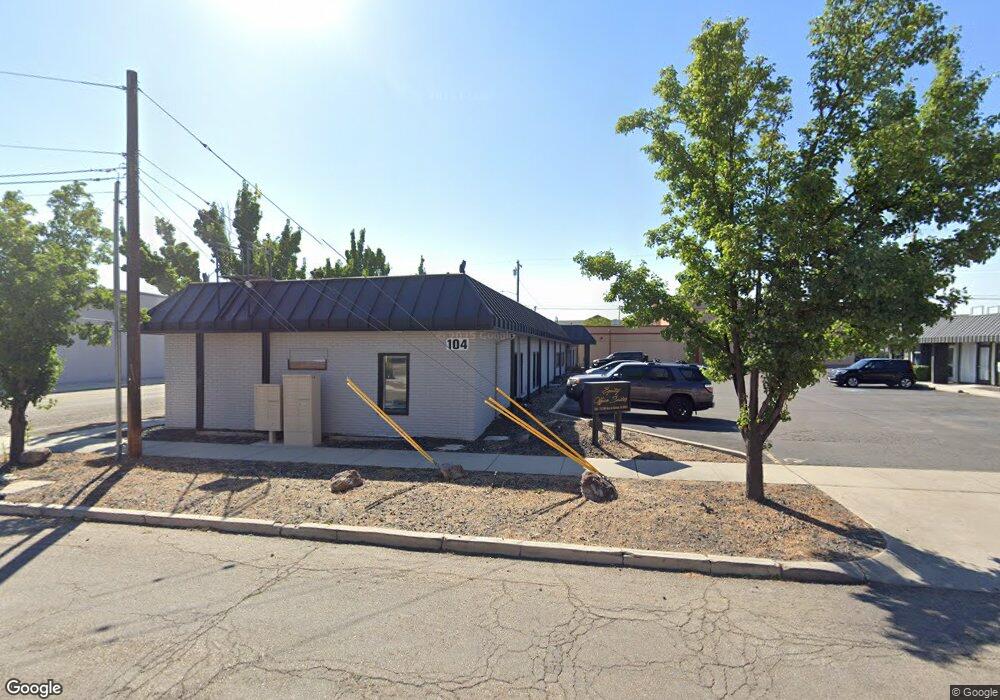
This home is located at 104 9th Ave S, Nampa, ID 83651 and is currently estimated at $980,848, approximately $129 per square foot. 104 9th Ave S is a home located in Canyon County with nearby schools including Central Elementary School, West Middle School, and Nampa Senior High School.
Ownership History
Date
Name
Owned For
Owner Type
Purchase Details
Closed on
Jan 22, 2021
Sold by
Equity Wealth Builders Llc
Bought by
Franklin 84 Investments Llc
Current Estimated Value
Purchase Details
Closed on
Dec 5, 2015
Sold by
Midland Trust Llc
Bought by
Equity Wealth Builders Llc
Purchase Details
Closed on
Mar 29, 2013
Sold by
Mountain Properties Inc
Bought by
Midland Trust Llc
Purchase Details
Closed on
Jul 14, 2010
Sold by
Moffitt Donald and Moffitt Roberta
Bought by
Syringa Bank
Purchase Details
Closed on
Dec 11, 2006
Sold by
Moffitt Donald and Moffitt Roberta
Bought by
Realex I Llc
Purchase Details
Closed on
Oct 31, 2006
Sold by
N Nampa Investors Llc
Bought by
Moffitt Donald and Moffitt Roberta
Purchase Details
Closed on
Aug 28, 2006
Sold by
Laney Gary W and Laney Calista
Bought by
N Nampa Investors Llc
Create a Home Valuation Report for This Property
The Home Valuation Report is an in-depth analysis detailing your home's value as well as a comparison with similar homes in the area
Home Values in the Area
Average Home Value in this Area
Purchase History
| Date | Buyer | Sale Price | Title Company |
|---|---|---|---|
| Franklin 84 Investments Llc | -- | Alliance Title | |
| Equity Wealth Builders Llc | -- | None Available | |
| Midland Trust Llc | -- | Titleone Boise | |
| Syringa Bank | $443,450 | Alliance Title Production | |
| Realex I Llc | -- | Accommodation | |
| Moffitt Donald | -- | Pioneer Title Company | |
| N Nampa Investors Llc | -- | None Available | |
| Oaas Laney Llc | -- | None Available |
Source: Public Records
Tax History Compared to Growth
Tax History
| Year | Tax Paid | Tax Assessment Tax Assessment Total Assessment is a certain percentage of the fair market value that is determined by local assessors to be the total taxable value of land and additions on the property. | Land | Improvement |
|---|---|---|---|---|
| 2025 | $7,262 | $1,030,050 | $401,450 | $628,600 |
| 2024 | $7,262 | $1,015,220 | $384,720 | $630,500 |
| 2023 | $7,189 | $954,190 | $367,990 | $586,200 |
| 2022 | $6,192 | $838,840 | $334,540 | $504,300 |
| 2021 | $8,304 | $704,890 | $209,090 | $495,800 |
| 2020 | $5,927 | $457,700 | $138,000 | $319,700 |
| 2019 | $7,248 | $451,700 | $138,000 | $313,700 |
| 2018 | $7,507 | $0 | $0 | $0 |
| 2017 | $7,548 | $0 | $0 | $0 |
| 2016 | $7,596 | $0 | $0 | $0 |
| 2015 | $7,289 | $0 | $0 | $0 |
| 2014 | $6,607 | $339,000 | $126,000 | $213,000 |
Source: Public Records
Map
Nearby Homes
- 104 9th Ave S Unit Lots 14, 16 & 18 of
- 112 9th Ave S
- 120 9th Ave S
- 912 1st St N
- 103 10th Ave S
- 204 9th Ave S
- 911 2nd St S
- 212 9th Ave S
- 209 9th Ave S Unit 209
- 211 9th Ave S
- 101 11th Ave S
- 908 3rd St S
- Lot 10 Vista Ridge Sub Blk 5
- 807 2nd St S
- 204 10th Ave S
- 212 10th Ave S
- 924 3rd St S
- 826 3rd St S
- 224 10th Ave S
- 111 8th Ave S