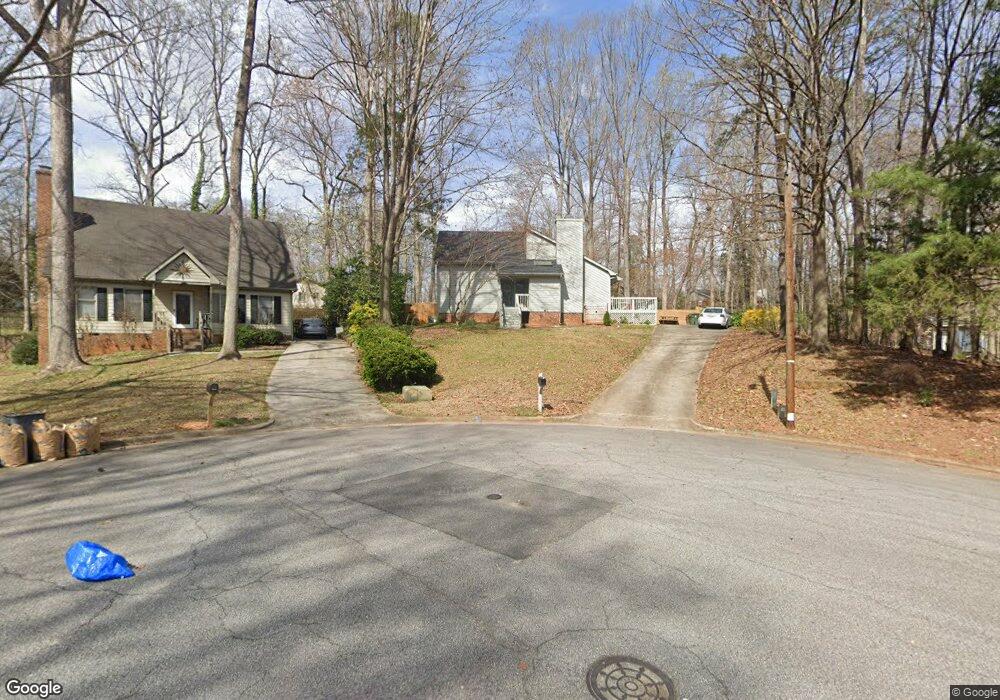
104 Akiry Ct Cary, NC 27511
South Cary NeighborhoodEstimated Value: $464,000 - $528,000
3
Beds
2
Baths
1,930
Sq Ft
$257/Sq Ft
Est. Value
About This Home
This home is located at 104 Akiry Ct, Cary, NC 27511 and is currently estimated at $496,859, approximately $257 per square foot. 104 Akiry Ct is a home located in Wake County with nearby schools including Farmington Woods Elementary, East Cary Middle School, and Cary High School.
Ownership History
Date
Name
Owned For
Owner Type
Purchase Details
Closed on
Jul 29, 2019
Sold by
Hartley Susan Edison
Bought by
Phillips Barrett W and Gillis Kristen M
Current Estimated Value
Home Financials for this Owner
Home Financials are based on the most recent Mortgage that was taken out on this home.
Original Mortgage
$232,000
Outstanding Balance
$203,688
Interest Rate
3.82%
Mortgage Type
New Conventional
Estimated Equity
$293,171
Purchase Details
Closed on
Dec 4, 2003
Sold by
Hartley Thomas Neil
Bought by
Hartley Susan Edison
Home Financials for this Owner
Home Financials are based on the most recent Mortgage that was taken out on this home.
Original Mortgage
$117,000
Interest Rate
3.75%
Mortgage Type
Purchase Money Mortgage
Purchase Details
Closed on
Apr 9, 1999
Sold by
Mcgrath Susan A and Carroll Russell Dean
Bought by
Hartley Thomas Neil and Hartley Susan Edison
Home Financials for this Owner
Home Financials are based on the most recent Mortgage that was taken out on this home.
Original Mortgage
$142,100
Interest Rate
5.25%
Create a Home Valuation Report for This Property
The Home Valuation Report is an in-depth analysis detailing your home's value as well as a comparison with similar homes in the area
Home Values in the Area
Average Home Value in this Area
Purchase History
| Date | Buyer | Sale Price | Title Company |
|---|---|---|---|
| Phillips Barrett W | $290,000 | None Available | |
| Hartley Susan Edison | -- | -- | |
| Hartley Thomas Neil | $158,000 | -- |
Source: Public Records
Mortgage History
| Date | Status | Borrower | Loan Amount |
|---|---|---|---|
| Open | Phillips Barrett W | $232,000 | |
| Previous Owner | Hartley Susan Edison | $117,000 | |
| Previous Owner | Hartley Thomas Neil | $142,100 |
Source: Public Records
Tax History
| Year | Tax Paid | Tax Assessment Tax Assessment Total Assessment is a certain percentage of the fair market value that is determined by local assessors to be the total taxable value of land and additions on the property. | Land | Improvement |
|---|---|---|---|---|
| 2025 | $3,875 | $449,817 | $190,000 | $259,817 |
| 2024 | $3,792 | $449,817 | $190,000 | $259,817 |
Source: Public Records
Map
Nearby Homes
- 1722 Seabrook Ave
- 3413 Wellington Ridge Loop
- 1641 Kildonan Place
- 124 Rosewall Ln
- 107 Larkwood Ln
- 300 W Kirkfield Dr
- 102 Shriver Ct
- 0 SE Cary Pkwy Unit 2491180
- 516 Spring Flower Ct
- 512 Spring Flower Ct
- 111 W Laurenbrook Ct
- 1017 Thistle Briar Place
- 6315 Tryon Rd
- 1424 Kildaire Farm Rd
- 1331 Kingston Ridge Rd
- 2210 Stephens Rd
- 105 Headlands Ln
- 2434 Stephens Rd
- 112 Queensferry Rd
- 137 Amesbury Ln
- 105 Akiry Ct
- 109 Coorsdale Dr
- 216 Heidinger Dr
- 111 Coorsdale Dr
- 214 Heidinger Dr
- 212 Heidinger Dr
- 107 Coorsdale Dr
- 113 Coorsdale Dr
- 103 Akiry Ct
- 218 Heidinger Dr
- 105 Coorsdale Dr
- 210 Heidinger Dr
- 220 Heidinger Dr
- 115 Coorsdale Dr
- 222 Heidinger Dr
- 103 Coorsdale Dr
- 215 Heidinger Dr
- 217 Heidinger Dr
- 108 Coorsdale Dr
- 110 Coorsdale Dr
Your Personal Tour Guide
Ask me questions while you tour the home.