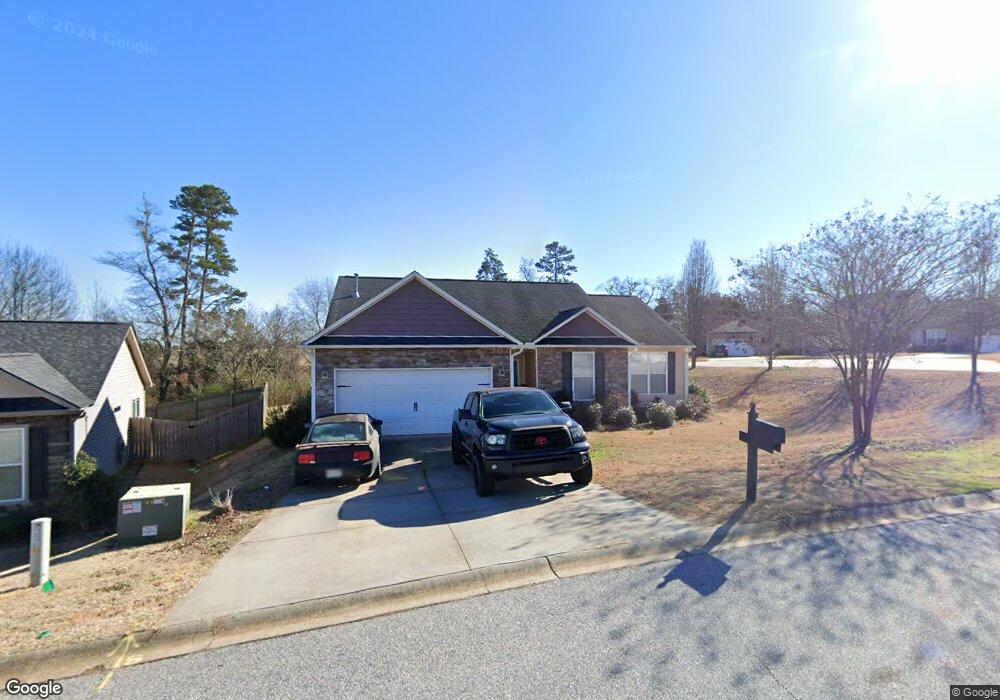
104 Alberta Cir Unit Lot 10 Blythwood Piedmont, SC 29673
Estimated Value: $291,000 - $316,000
3
Beds
2
Baths
1,400
Sq Ft
$219/Sq Ft
Est. Value
About This Home
This home is located at 104 Alberta Cir Unit Lot 10 Blythwood, Piedmont, SC 29673 and is currently estimated at $306,699, approximately $219 per square foot. 104 Alberta Cir Unit Lot 10 Blythwood is a home located in Anderson County with nearby schools including Wren Elementary School, Wren Middle School, and Wren High School.
Ownership History
Date
Name
Owned For
Owner Type
Purchase Details
Closed on
Apr 15, 2022
Sold by
Michael Billadeau Shaun
Bought by
Billadeau Shaun Michael
Current Estimated Value
Purchase Details
Closed on
Oct 12, 2018
Sold by
Johnson Brittany and Riley Brittany J
Bought by
Billadeau Shaun Michael and Grant Julia Lynn
Home Financials for this Owner
Home Financials are based on the most recent Mortgage that was taken out on this home.
Original Mortgage
$193,982
Interest Rate
4.5%
Mortgage Type
New Conventional
Purchase Details
Closed on
Mar 19, 2008
Sold by
Tower Homes Inc
Bought by
Johnson Brittany
Home Financials for this Owner
Home Financials are based on the most recent Mortgage that was taken out on this home.
Original Mortgage
$145,730
Interest Rate
5.68%
Mortgage Type
Purchase Money Mortgage
Purchase Details
Closed on
Nov 9, 2007
Sold by
Garrett R D and Garrett Rusty
Bought by
Tower Homes Inc
Create a Home Valuation Report for This Property
The Home Valuation Report is an in-depth analysis detailing your home's value as well as a comparison with similar homes in the area
Home Values in the Area
Average Home Value in this Area
Purchase History
| Date | Buyer | Sale Price | Title Company |
|---|---|---|---|
| Billadeau Shaun Michael | -- | None Listed On Document | |
| Billadeau Shaun Michael | $189,900 | None Available | |
| Johnson Brittany | $153,400 | Attorney | |
| Tower Homes Inc | $29,650 | Attorney |
Source: Public Records
Mortgage History
| Date | Status | Borrower | Loan Amount |
|---|---|---|---|
| Previous Owner | Billadeau Shaun Michael | $193,982 | |
| Previous Owner | Johnson Brittany | $145,730 |
Source: Public Records
Tax History Compared to Growth
Tax History
| Year | Tax Paid | Tax Assessment Tax Assessment Total Assessment is a certain percentage of the fair market value that is determined by local assessors to be the total taxable value of land and additions on the property. | Land | Improvement |
|---|---|---|---|---|
| 2024 | $40 | $9,900 | $1,680 | $8,220 |
| 2023 | $40 | $14,840 | $2,510 | $12,330 |
| 2022 | $1,203 | $9,900 | $1,680 | $8,220 |
| 2021 | $1,079 | $7,480 | $800 | $6,680 |
| 2020 | $1,099 | $7,480 | $800 | $6,680 |
| 2019 | $1,099 | $11,220 | $1,200 | $10,020 |
| 2018 | $823 | $5,850 | $800 | $5,050 |
| 2017 | -- | $5,850 | $800 | $5,050 |
| 2016 | $816 | $5,650 | $800 | $4,850 |
| 2015 | $865 | $5,650 | $800 | $4,850 |
| 2014 | $855 | $5,650 | $800 | $4,850 |
Source: Public Records
Map
Nearby Homes
- 1141 Broadrum St
- 828 Crispin St
- 501 Grantham Dr
- 335 Glass Rd
- 536 Grantham Dr
- Hayden Plan at Woodglen
- Aria Plan at Woodglen
- Biltmore Plan at Woodglen
- Penwell Plan at Woodglen
- Wilmington Plan at Woodglen
- Cali Plan at Woodglen
- Belhaven Plan at Woodglen
- 539 Grantham Dr
- 406 Strayhorn St
- 33 Joplin Dr
- 21 Joplin Dr
- 20 Joplin Dr
- 204 Mancini Rd
- 104 Alberta Cir
- 106 Alberta Cir
- 108 Alberta Cir
- 6 Avonlea Ct
- 102 Alberta Cir
- 105 Alberta Cir
- 4 Avonlea Ct
- 107 Alberta Cir
- 110 Alberta Cir
- 1010 Blythwood Dr
- 103 Alberta Cir
- 109 Alberta Cir
- 3 Prince Edward Ct
- 1012 Blythwood Dr
- 112 Alberta Cir
- 1014 Blythwood Dr
- 111 Alberta Cir
- 1008 Blythwood Dr
- 1009 Blythwood Dr
- 114 Alberta Cir