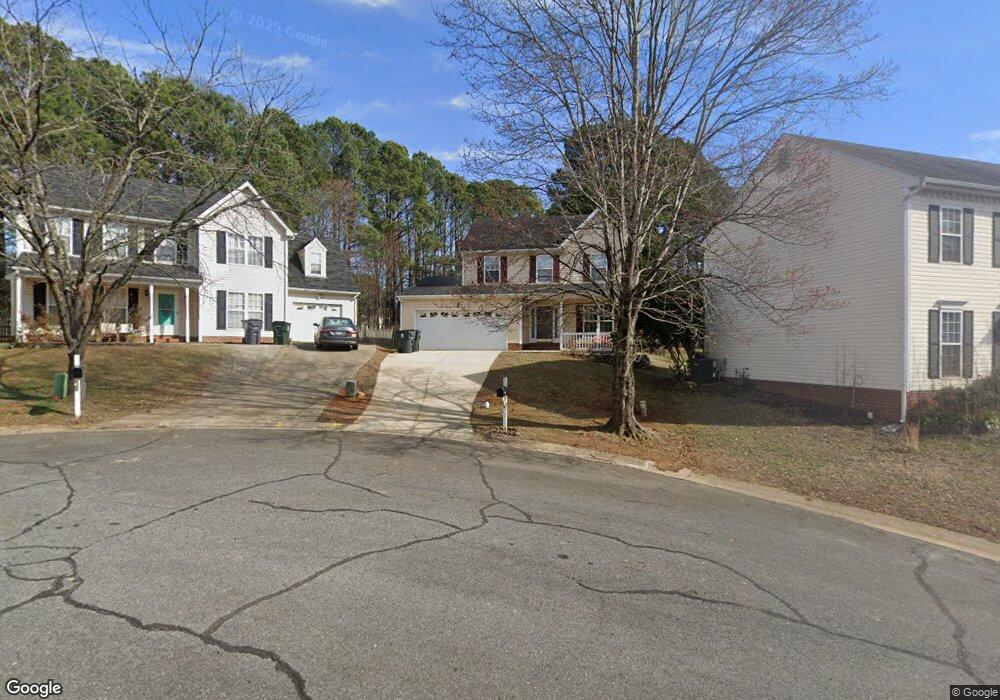
104 Arbor Wynds Ct Holly Springs, NC 27540
Estimated Value: $400,692 - $420,000
3
Beds
3
Baths
1,575
Sq Ft
$261/Sq Ft
Est. Value
About This Home
This home is located at 104 Arbor Wynds Ct, Holly Springs, NC 27540 and is currently estimated at $411,673, approximately $261 per square foot. 104 Arbor Wynds Ct is a home located in Wake County with nearby schools including Holly Springs Elementary School, Holly Ridge Middle School, and Apex Friendship High School.
Ownership History
Date
Name
Owned For
Owner Type
Purchase Details
Closed on
Oct 1, 2018
Sold by
Lheureux Robert L
Bought by
Castillo Trivino Juan F
Current Estimated Value
Home Financials for this Owner
Home Financials are based on the most recent Mortgage that was taken out on this home.
Original Mortgage
$235,710
Outstanding Balance
$205,553
Interest Rate
4.5%
Mortgage Type
New Conventional
Estimated Equity
$206,120
Purchase Details
Closed on
Mar 23, 2005
Sold by
Ford Alexander S and Ford Janet M
Bought by
Lheureux Robert L
Home Financials for this Owner
Home Financials are based on the most recent Mortgage that was taken out on this home.
Original Mortgage
$139,092
Interest Rate
5.54%
Mortgage Type
VA
Purchase Details
Closed on
Mar 18, 1999
Sold by
K R Builders Inc
Bought by
Ford Alexander S and Ford Janet M
Home Financials for this Owner
Home Financials are based on the most recent Mortgage that was taken out on this home.
Original Mortgage
$125,350
Interest Rate
6.74%
Mortgage Type
FHA
Create a Home Valuation Report for This Property
The Home Valuation Report is an in-depth analysis detailing your home's value as well as a comparison with similar homes in the area
Home Values in the Area
Average Home Value in this Area
Purchase History
| Date | Buyer | Sale Price | Title Company |
|---|---|---|---|
| Castillo Trivino Juan F | $243,000 | None Available | |
| Lheureux Robert L | $144,000 | -- | |
| Ford Alexander S | $128,000 | -- |
Source: Public Records
Mortgage History
| Date | Status | Borrower | Loan Amount |
|---|---|---|---|
| Open | Castillo Trivino Juan F | $235,710 | |
| Previous Owner | Lheureux Robert L | $139,092 | |
| Previous Owner | Ford Alexander S | $125,350 |
Source: Public Records
Tax History Compared to Growth
Tax History
| Year | Tax Paid | Tax Assessment Tax Assessment Total Assessment is a certain percentage of the fair market value that is determined by local assessors to be the total taxable value of land and additions on the property. | Land | Improvement |
|---|---|---|---|---|
| 2025 | $3,118 | $360,005 | $110,000 | $250,005 |
| 2024 | $3,105 | $360,005 | $110,000 | $250,005 |
| 2023 | $2,591 | $238,342 | $55,000 | $183,342 |
| 2022 | $2,501 | $238,342 | $55,000 | $183,342 |
| 2021 | $2,455 | $238,342 | $55,000 | $183,342 |
| 2020 | $2,455 | $238,342 | $55,000 | $183,342 |
| 2019 | $2,186 | $180,038 | $50,000 | $130,038 |
| 2018 | $0 | $180,038 | $50,000 | $130,038 |
| 2017 | $1,906 | $180,038 | $50,000 | $130,038 |
| 2016 | $1,880 | $180,038 | $50,000 | $130,038 |
| 2015 | $1,716 | $161,641 | $36,000 | $125,641 |
| 2014 | -- | $161,641 | $36,000 | $125,641 |
Source: Public Records
Map
Nearby Homes
- 213 Capello Ct
- 204 Leafgate Ct
- 1539 N Main St
- 201 Holmby Ct
- 425 Arbor Creek Dr
- 317 Commons Dr
- 148 Danesway Dr
- 138 Cobalt Creek Way
- 116 Cobblebrook Ct
- 225 Hazelmere Dr
- 112 Fairford Dr
- 112 Sanchez Ct
- 300 Firefly Rd
- 208 Apple Drupe Way
- 329 N Main St
- 212 Windcap Dr
- 5620 Lockley Rd
- 102 Spring Dove Ln
- 204 Chrismill Ln
- 5325 Dutch Elm Dr
- 108 Arbor Wynds Ct
- 305 Arbor Crest Rd
- 100 Arbor Wynds Ct
- 309 Arbor Crest Rd
- 112 Arbor Wynds Ct
- 313 Arbor Crest Rd
- 208 Creek Haven Dr
- 204 Creek Haven Dr
- 209 Arbor Crest Rd
- 109 Arbor Wynds Ct
- 212 Creek Haven Dr
- 104 Morena Dr
- 200 Creek Haven Dr
- 304 Arbor Crest Rd
- 300 Arbor Crest Rd
- 105 Arbor Wynds Ct
- 317 Arbor Crest Rd
- 10 Morena Dr
- 8 Morena Dr
- 108 Morena Dr