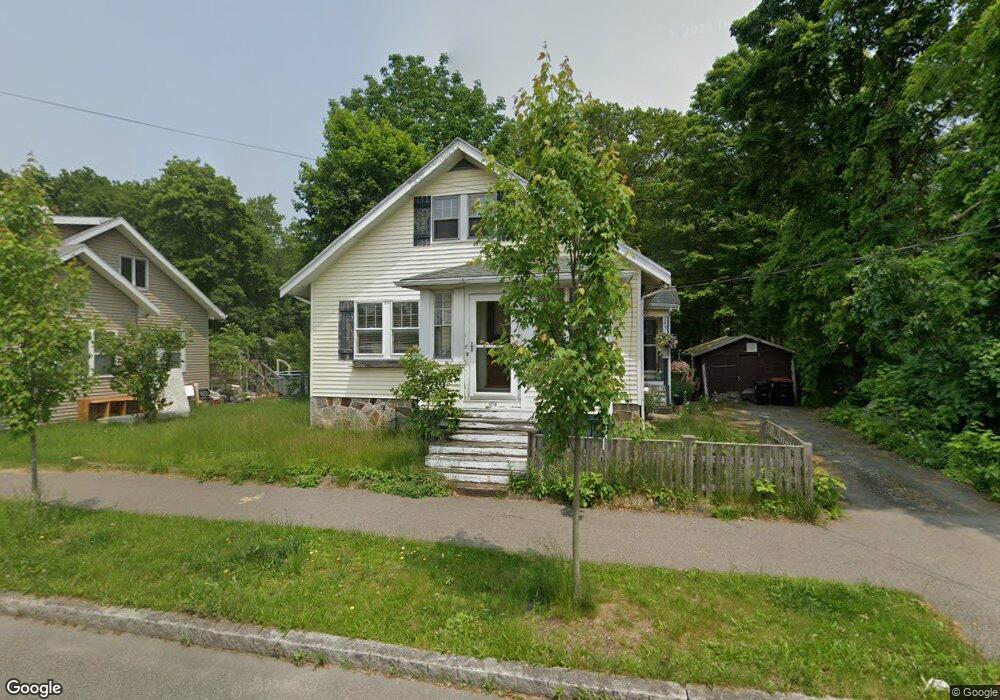
104 Bouve Ave Brockton, MA 02301
Clifton Heights NeighborhoodEstimated Value: $377,000 - $436,000
2
Beds
1
Bath
1,077
Sq Ft
$380/Sq Ft
Est. Value
About This Home
This home is located at 104 Bouve Ave, Brockton, MA 02301 and is currently estimated at $408,945, approximately $379 per square foot. 104 Bouve Ave is a home located in Plymouth County with nearby schools including John F. Kennedy Elementary School, Davis K-8 School, and South Middle School.
Ownership History
Date
Name
Owned For
Owner Type
Purchase Details
Closed on
May 28, 2004
Sold by
Landry Edward H and Landry Jeanette L
Bought by
Cox Henry J
Current Estimated Value
Home Financials for this Owner
Home Financials are based on the most recent Mortgage that was taken out on this home.
Original Mortgage
$197,000
Outstanding Balance
$95,525
Interest Rate
5.88%
Mortgage Type
Purchase Money Mortgage
Estimated Equity
$313,420
Create a Home Valuation Report for This Property
The Home Valuation Report is an in-depth analysis detailing your home's value as well as a comparison with similar homes in the area
Home Values in the Area
Average Home Value in this Area
Purchase History
| Date | Buyer | Sale Price | Title Company |
|---|---|---|---|
| Cox Henry J | $207,500 | -- |
Source: Public Records
Mortgage History
| Date | Status | Borrower | Loan Amount |
|---|---|---|---|
| Open | Cox Henry J | $197,000 |
Source: Public Records
Tax History Compared to Growth
Tax History
| Year | Tax Paid | Tax Assessment Tax Assessment Total Assessment is a certain percentage of the fair market value that is determined by local assessors to be the total taxable value of land and additions on the property. | Land | Improvement |
|---|---|---|---|---|
| 2025 | $4,166 | $344,000 | $140,000 | $204,000 |
| 2024 | $3,909 | $325,200 | $140,000 | $185,200 |
| 2023 | $3,615 | $278,500 | $104,100 | $174,400 |
| 2022 | $3,868 | $276,900 | $94,600 | $182,300 |
| 2021 | $3,325 | $229,300 | $78,500 | $150,800 |
| 2020 | $3,247 | $214,300 | $73,600 | $140,700 |
| 2019 | $3,179 | $204,600 | $71,800 | $132,800 |
| 2018 | $2,936 | $182,800 | $71,800 | $111,000 |
| 2017 | $2,882 | $179,000 | $71,800 | $107,200 |
| 2016 | $2,547 | $146,700 | $69,600 | $77,100 |
| 2015 | $2,332 | $128,500 | $69,600 | $58,900 |
| 2014 | $2,520 | $139,000 | $69,600 | $69,400 |
Source: Public Records
Map
Nearby Homes