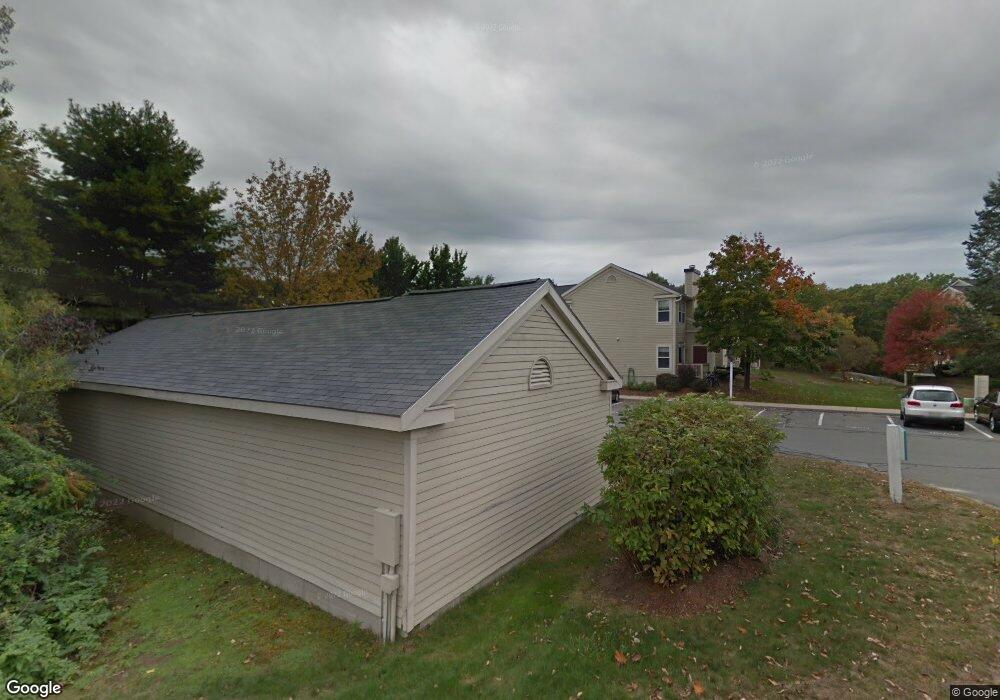
104 Bradford Commons Ln Braintree, MA 02184
South Braintree NeighborhoodEstimated Value: $474,000 - $552,000
2
Beds
3
Baths
1,169
Sq Ft
$433/Sq Ft
Est. Value
About This Home
This home is located at 104 Bradford Commons Ln, Braintree, MA 02184 and is currently estimated at $506,315, approximately $433 per square foot. 104 Bradford Commons Ln is a home located in Norfolk County with nearby schools including Braintree High School, First Baptist Christian School, and CATS Academy Boston.
Ownership History
Date
Name
Owned For
Owner Type
Purchase Details
Closed on
Oct 31, 2001
Sold by
Xu Dong
Bought by
Tenaglia Robert J
Current Estimated Value
Home Financials for this Owner
Home Financials are based on the most recent Mortgage that was taken out on this home.
Original Mortgage
$170,000
Outstanding Balance
$66,934
Interest Rate
6.82%
Mortgage Type
Purchase Money Mortgage
Estimated Equity
$439,381
Purchase Details
Closed on
Oct 31, 1997
Sold by
Stricklin Sandra L
Bought by
Xu Dong
Home Financials for this Owner
Home Financials are based on the most recent Mortgage that was taken out on this home.
Original Mortgage
$114,400
Interest Rate
7.31%
Mortgage Type
Purchase Money Mortgage
Purchase Details
Closed on
Aug 16, 1994
Sold by
Seaward Sydney L
Bought by
Stricklin Sandra L
Create a Home Valuation Report for This Property
The Home Valuation Report is an in-depth analysis detailing your home's value as well as a comparison with similar homes in the area
Home Values in the Area
Average Home Value in this Area
Purchase History
| Date | Buyer | Sale Price | Title Company |
|---|---|---|---|
| Tenaglia Robert J | $250,000 | -- | |
| Xu Dong | $143,000 | -- | |
| Stricklin Sandra L | $1,500 | -- |
Source: Public Records
Mortgage History
| Date | Status | Borrower | Loan Amount |
|---|---|---|---|
| Open | Tenaglia Robert J | $170,000 | |
| Previous Owner | Stricklin Sandra L | $30,000 | |
| Previous Owner | Stricklin Sandra L | $114,400 |
Source: Public Records
Tax History Compared to Growth
Tax History
| Year | Tax Paid | Tax Assessment Tax Assessment Total Assessment is a certain percentage of the fair market value that is determined by local assessors to be the total taxable value of land and additions on the property. | Land | Improvement |
|---|---|---|---|---|
| 2025 | $4,807 | $481,700 | $0 | $481,700 |
| 2024 | $4,311 | $454,700 | $0 | $454,700 |
| 2023 | $3,847 | $394,200 | $0 | $394,200 |
| 2022 | $3,667 | $368,500 | $0 | $368,500 |
| 2021 | $3,588 | $360,600 | $0 | $360,600 |
| 2020 | $3,414 | $346,200 | $0 | $346,200 |
| 2019 | $3,368 | $333,800 | $0 | $333,800 |
| 2018 | $3,259 | $309,200 | $0 | $309,200 |
| 2017 | $3,212 | $299,100 | $0 | $299,100 |
| 2016 | $3,063 | $279,000 | $0 | $279,000 |
| 2015 | $2,988 | $269,900 | $0 | $269,900 |
| 2014 | $2,940 | $257,400 | $0 | $257,400 |
Source: Public Records
Map
Nearby Homes
- 175 Tyson Commons Ln
- 134 Tyson Commons Ln
- 30 Bradford Commons Ln
- 354 Tilden Commons Ln
- 278 Allerton Commons Ln
- 68 Massapoag St Unit 7
- 57 Daniel Rd
- 70 Christina Dr
- 1501 Liberty St
- 308 Forest St
- 16 Jay Rd
- 24 Fisher Rd
- 193 Randolph St
- 116 Cardinal Ct
- 1696 Liberty St
- 7 Drake St
- 432 Grove St
- 22 Medallion Rd
- 120 Randolph St
- 92 Mercury St
- 112 Bradford Commons Ln
- 111 Bradford Commons Ln
- 110 Bradford Commons Ln
- 108 Bradford Commons Ln
- 107 Bradford Commons Ln
- 106 Bradford Commons Ln
- 105 Bradford Commons Ln
- 103 Bradford Commons Ln
- 102 Bradford Commons Ln
- 101 Bradford Commons Ln
- 100 Bradford Commons Ln
- 99 Bradford Commons Ln
- 98 Bradford Commons Ln
- 97 Bradford Commons Ln
- 96 Bradford Commons Ln
- 95 Bradford Commons Ln
- 94 Bradford Commons Ln
- 93 Bradford Commons Ln
- 105 Bradford Commons Ln Unit 105
- 108 Bradford Commons Ln Unit 108