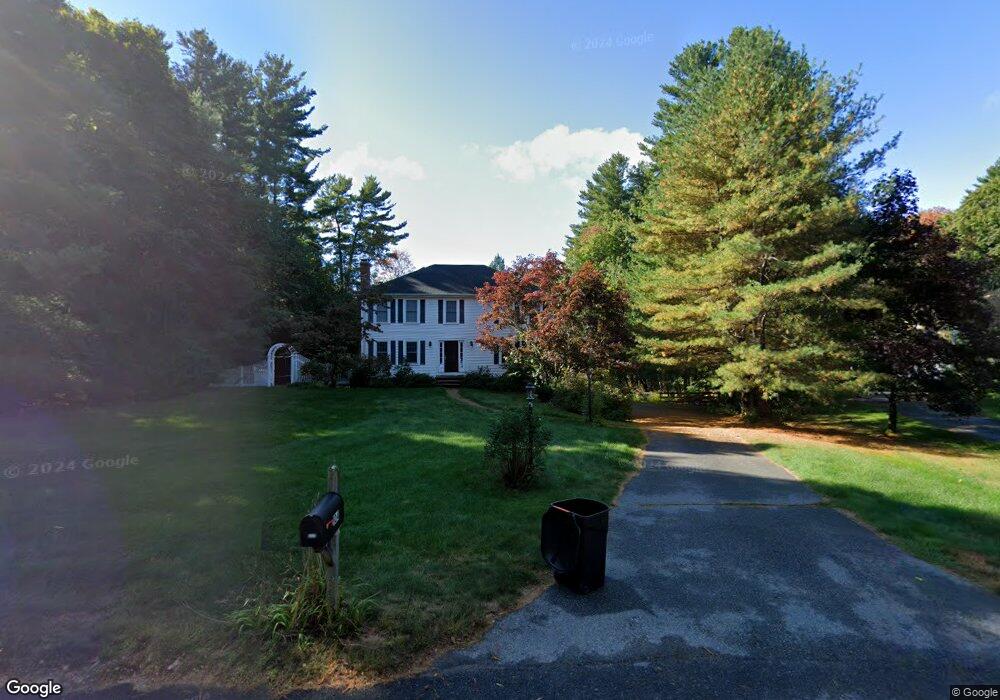
104 Bridges Ln North Andover, MA 01845
Estimated Value: $971,000 - $1,099,000
4
Beds
3
Baths
2,432
Sq Ft
$422/Sq Ft
Est. Value
About This Home
This home is located at 104 Bridges Ln, North Andover, MA 01845 and is currently estimated at $1,027,142, approximately $422 per square foot. 104 Bridges Ln is a home located in Essex County with nearby schools including Annie L Sargent Elementary School, North Andover Middle School, and North Andover High School.
Ownership History
Date
Name
Owned For
Owner Type
Purchase Details
Closed on
Oct 23, 2019
Sold by
Ross Gordon W and Sager-Ross Julia
Bought by
104 Bridges Rt
Current Estimated Value
Purchase Details
Closed on
Apr 22, 2005
Sold by
Kelly Kevin S and Kelly Maureen K
Bought by
Ross Gordon W and Ross Julia S
Purchase Details
Closed on
Jul 31, 2002
Sold by
Booth Donald J and Booth Patricia S
Bought by
Kelly Kevin S and Kelly Maureen K
Create a Home Valuation Report for This Property
The Home Valuation Report is an in-depth analysis detailing your home's value as well as a comparison with similar homes in the area
Home Values in the Area
Average Home Value in this Area
Purchase History
| Date | Buyer | Sale Price | Title Company |
|---|---|---|---|
| 104 Bridges Rt | -- | None Available | |
| Ross Gordon W | $608,000 | -- | |
| Kelly Kevin S | $505,000 | -- |
Source: Public Records
Mortgage History
| Date | Status | Borrower | Loan Amount |
|---|---|---|---|
| Previous Owner | Kelly Kevin S | $303,000 | |
| Previous Owner | Kelly Kevin S | $100,000 |
Source: Public Records
Tax History Compared to Growth
Tax History
| Year | Tax Paid | Tax Assessment Tax Assessment Total Assessment is a certain percentage of the fair market value that is determined by local assessors to be the total taxable value of land and additions on the property. | Land | Improvement |
|---|---|---|---|---|
| 2025 | $9,925 | $881,400 | $413,900 | $467,500 |
| 2024 | $9,436 | $850,900 | $392,100 | $458,800 |
| 2023 | $8,992 | $734,600 | $331,200 | $403,400 |
| 2022 | $8,552 | $632,100 | $287,600 | $344,500 |
| 2021 | $8,209 | $579,300 | $261,500 | $317,800 |
| 2020 | $7,869 | $572,700 | $254,900 | $317,800 |
| 2019 | $7,680 | $572,700 | $254,900 | $317,800 |
| 2018 | $8,321 | $572,700 | $254,900 | $317,800 |
| 2017 | $7,254 | $508,000 | $224,400 | $283,600 |
| 2016 | $6,944 | $486,600 | $226,600 | $260,000 |
| 2015 | $6,842 | $475,500 | $213,100 | $262,400 |
Source: Public Records
Map
Nearby Homes
- 125 Lancaster Rd
- 590 Foster St
- 30 Sherwood Dr
- 155 Duncan Dr
- 105 Weyland Cir
- 50 Rocky Brook Rd
- 54 Sterling Ln
- 75 Thistle Rd
- 453 Forest St
- 26 Woodberry Ln
- 234 Brentwood Cir
- 82 Raleigh Tavern Ln
- 495 Johnson St
- 26 Bayns Hill Rd
- 20 Highwood Way
- 316 Johnson St
- 894 Great Pond Rd
- 65 Saile Way
- 499 Main St
- 127 Tucker Farm Rd