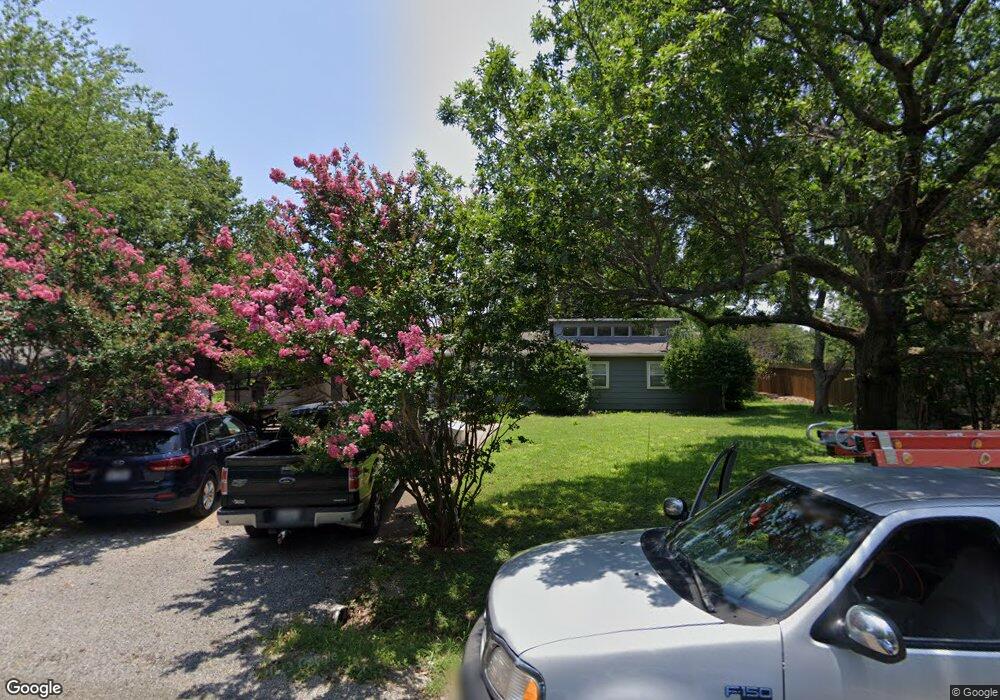
104 Castle Dr Pottsboro, TX 75076
Estimated Value: $233,658 - $382,000
2
Beds
1
Bath
862
Sq Ft
$381/Sq Ft
Est. Value
About This Home
This home is located at 104 Castle Dr, Pottsboro, TX 75076 and is currently estimated at $328,665, approximately $381 per square foot. 104 Castle Dr is a home located in Grayson County with nearby schools including Pottsboro Elementary School, Pottsboro Middle School, and Pottsboro High School.
Ownership History
Date
Name
Owned For
Owner Type
Purchase Details
Closed on
Apr 8, 2013
Sold by
Johnson Shannon H and Rube Lezlie
Bought by
Beckham Larry and Beckham Janey
Current Estimated Value
Home Financials for this Owner
Home Financials are based on the most recent Mortgage that was taken out on this home.
Original Mortgage
$49,600
Outstanding Balance
$35,248
Interest Rate
3.62%
Mortgage Type
New Conventional
Estimated Equity
$293,417
Purchase Details
Closed on
Mar 27, 2006
Sold by
Johnson Shannon H
Bought by
Johnson Shannon H and Rube Lezlie
Purchase Details
Closed on
May 10, 2005
Sold by
Dickey Frank A
Bought by
Johnson Shannon
Home Financials for this Owner
Home Financials are based on the most recent Mortgage that was taken out on this home.
Original Mortgage
$58,710
Interest Rate
7.75%
Mortgage Type
Fannie Mae Freddie Mac
Create a Home Valuation Report for This Property
The Home Valuation Report is an in-depth analysis detailing your home's value as well as a comparison with similar homes in the area
Home Values in the Area
Average Home Value in this Area
Purchase History
| Date | Buyer | Sale Price | Title Company |
|---|---|---|---|
| Beckham Larry | -- | Red River Title Co | |
| Johnson Shannon H | -- | None Available | |
| Johnson Shannon | -- | -- |
Source: Public Records
Mortgage History
| Date | Status | Borrower | Loan Amount |
|---|---|---|---|
| Open | Beckham Larry | $49,600 | |
| Previous Owner | Johnson Shannon | $58,710 |
Source: Public Records
Tax History Compared to Growth
Tax History
| Year | Tax Paid | Tax Assessment Tax Assessment Total Assessment is a certain percentage of the fair market value that is determined by local assessors to be the total taxable value of land and additions on the property. | Land | Improvement |
|---|---|---|---|---|
| 2025 | $1,417 | $260,181 | -- | -- |
| 2024 | $3,277 | $236,528 | $0 | $0 |
| 2023 | $1,419 | $215,025 | $0 | $0 |
| 2022 | $3,077 | $195,477 | $40,457 | $155,020 |
| 2021 | $2,171 | $133,526 | $19,515 | $114,011 |
| 2020 | $2,339 | $138,542 | $21,467 | $117,075 |
| 2019 | $2,132 | $120,521 | $27,321 | $93,200 |
| 2018 | $1,901 | $106,098 | $15,612 | $90,486 |
| 2017 | $1,758 | $96,855 | $15,612 | $81,243 |
| 2016 | $1,717 | $94,594 | $15,612 | $78,982 |
| 2015 | $1,126 | $60,932 | $15,612 | $45,320 |
| 2014 | $1,149 | $61,679 | $15,612 | $46,067 |
Source: Public Records
Map
Nearby Homes
- 34 Cambridge Dr
- 81 Windsor Dr
- 545 Black Forest Dr
- 142 Wales Dr
- 207 Wales Dr
- 226 Cambridge Dr
- 344 Castle Dr
- 191 Black Forest Dr
- 491 Black Forest Dr
- 16 Wales Dr
- 83 Mayfield Ln
- 11 Mayfield Ln
- 219 Ray Rd
- 33 Queens Dr
- 118 Hacienda Dr
- 116 Oak Hills Dr
- 766 Lakepoint Loop
- 188 Hacienda Dr
- 258 Lou-Sand Hill Rd
- Lot 55 Doe Crossing