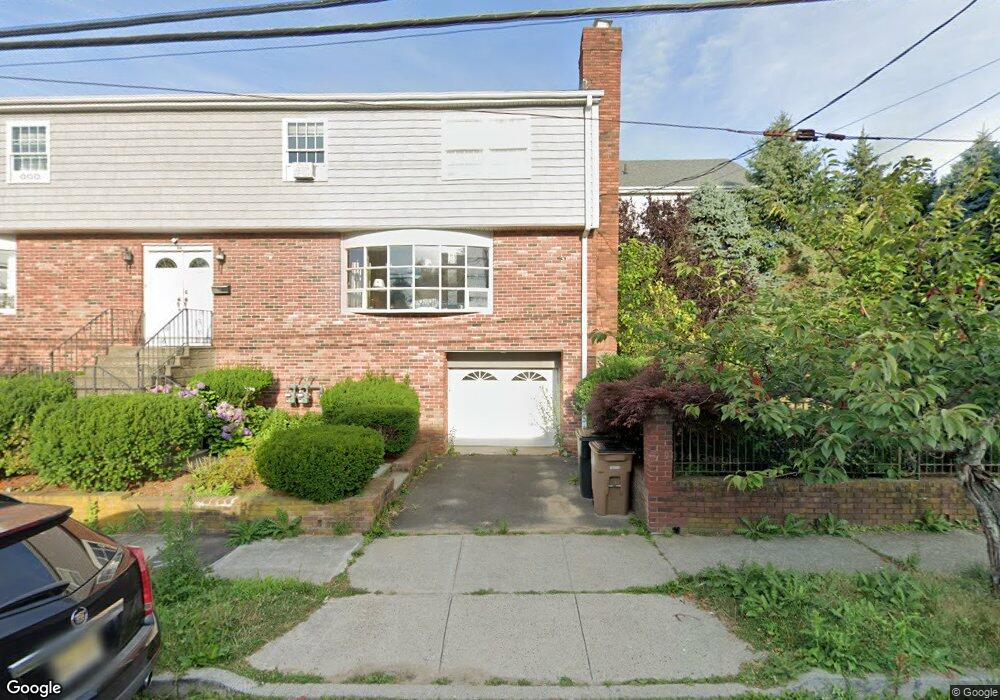
104 Colonial Rd Stamford, CT 06906
Glenbrook NeighborhoodEstimated Value: $922,582 - $1,102,000
6
Beds
4
Baths
4,377
Sq Ft
$232/Sq Ft
Est. Value
About This Home
This home is located at 104 Colonial Rd, Stamford, CT 06906 and is currently estimated at $1,015,646, approximately $232 per square foot. 104 Colonial Rd is a home located in Fairfield County with nearby schools including Julia A. Stark Elementary School, Dolan School, and Stamford High School.
Ownership History
Date
Name
Owned For
Owner Type
Purchase Details
Closed on
Jan 13, 2023
Sold by
Licursi Antonio Est and Licursi
Bought by
Aguirre Edwin and Fiallos Geovanna
Current Estimated Value
Home Financials for this Owner
Home Financials are based on the most recent Mortgage that was taken out on this home.
Original Mortgage
$700,800
Outstanding Balance
$674,126
Interest Rate
6.33%
Mortgage Type
New Conventional
Estimated Equity
$341,520
Purchase Details
Closed on
Dec 1, 2004
Sold by
Russo Maria and Licursi John
Bought by
Licursi Antonio
Home Financials for this Owner
Home Financials are based on the most recent Mortgage that was taken out on this home.
Original Mortgage
$100,000
Interest Rate
5.74%
Purchase Details
Closed on
Dec 24, 2001
Sold by
Lioursi Luigi
Bought by
Russo Maria and Lioursi John
Create a Home Valuation Report for This Property
The Home Valuation Report is an in-depth analysis detailing your home's value as well as a comparison with similar homes in the area
Home Values in the Area
Average Home Value in this Area
Purchase History
| Date | Buyer | Sale Price | Title Company |
|---|---|---|---|
| Aguirre Edwin | $876,000 | None Available | |
| Aguirre Edwin | $876,000 | None Available | |
| Aguirre Edwin | $876,000 | None Available | |
| Licursi Antonio | $80,000 | -- | |
| Licursi Antonio | $80,000 | -- | |
| Russo Maria | $125,000 | -- | |
| Russo Maria | $125,000 | -- |
Source: Public Records
Mortgage History
| Date | Status | Borrower | Loan Amount |
|---|---|---|---|
| Open | Aguirre Edwin | $700,800 | |
| Closed | Aguirre Edwin | $700,800 | |
| Previous Owner | Russo Maria | $400,000 | |
| Previous Owner | Russo Maria | $100,000 |
Source: Public Records
Tax History
| Year | Tax Paid | Tax Assessment Tax Assessment Total Assessment is a certain percentage of the fair market value that is determined by local assessors to be the total taxable value of land and additions on the property. | Land | Improvement |
|---|---|---|---|---|
| 2025 | $13,916 | $581,770 | $205,810 | $375,960 |
| 2024 | $13,590 | $581,770 | $205,810 | $375,960 |
| 2023 | $14,377 | $569,620 | $205,810 | $363,810 |
| 2022 | $10,689 | $393,420 | $157,980 | $235,440 |
| 2021 | $10,599 | $393,420 | $157,980 | $235,440 |
| 2020 | $10,367 | $393,420 | $157,980 | $235,440 |
| 2019 | $10,367 | $393,420 | $157,980 | $235,440 |
| 2018 | $10,044 | $393,420 | $157,980 | $235,440 |
| 2017 | $9,193 | $341,870 | $132,710 | $209,160 |
| 2016 | $8,930 | $341,870 | $132,710 | $209,160 |
| 2015 | $8,694 | $341,870 | $132,710 | $209,160 |
| 2014 | $8,475 | $341,870 | $132,710 | $209,160 |
Source: Public Records
Map
Nearby Homes
- 168 Colonial Rd Unit 6
- 255 Strawberry Hill Ave Unit B1
- 180 Colonial Rd Unit A2
- 237 Strawberry Hill Ave Unit 27
- 75 Coolidge Ave
- 20 Norman Rd
- 408 Strawberry Hill Ave
- 29 Vincent Ave
- 132 Hope St Unit C
- 136 Center St
- 108 Strawberry Hill Ave Unit 1
- 11 Belltown Rd Unit 1
- 104 Strawberry Hill Ave Unit 1
- 104 Strawberry Hill Ave Unit 2
- 39 Crane Rd
- 100 Hope St Unit 10
- 71 Strawberry Hill Ave Unit 515
- 90 Strawberry Hill Ave Unit 3
- 91 Strawberry Hill Ave Unit 139
- 91 Strawberry Hill Ave Unit 639
- 104 Mayflower Ave
- 140 Colonial Rd
- 140 Colonial Rd Unit 1
- 100 Mayflower Ave
- 126 Colonial Rd
- 144 Colonial Rd
- 124 Colonial Rd
- 96 Mayflower Ave Unit 2ndfl
- 96 Mayflower Ave Unit H2
- 148 Colonial Rd
- 148 Colonial Rd Unit 2
- 118 Colonial Rd
- 118 Colonial Rd Unit 1
- 118 Colonial Rd Unit Basement
- 118 Colonial Rd Unit 2
- 85 Plymouth Rd
- 85 Plymouth Rd Unit 2
- 162 Colonial Rd Unit 12
- 162 Colonial Rd Unit 11
- 162 Colonial Rd Unit 10
Your Personal Tour Guide
Ask me questions while you tour the home.