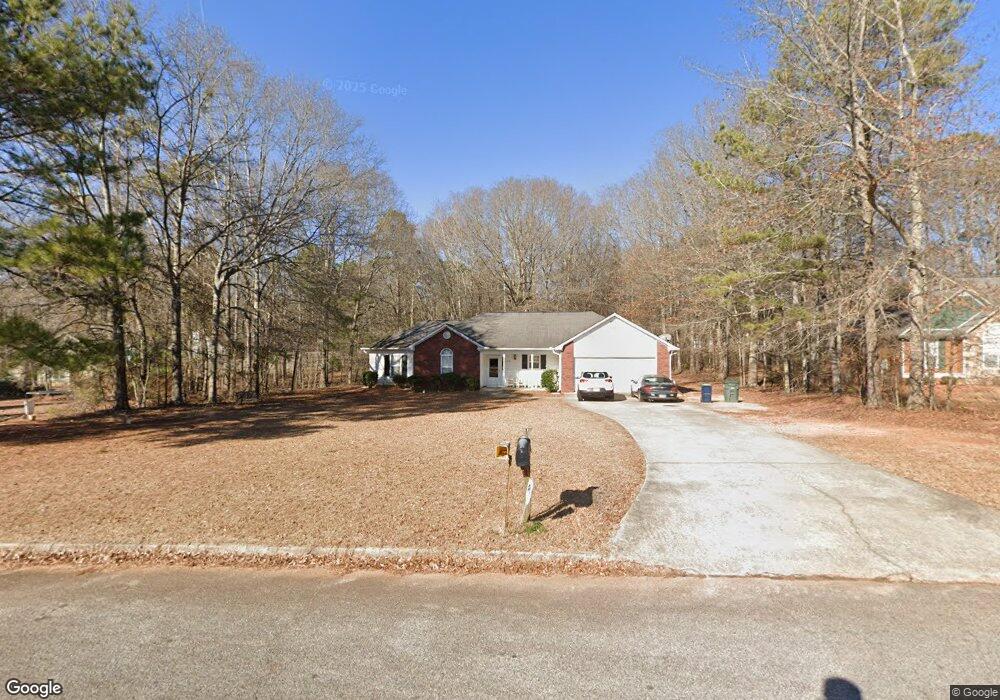
104 Derby Dr Unit III Griffin, GA 30224
Spalding County NeighborhoodEstimated Value: $224,000 - $255,000
3
Beds
2
Baths
1,555
Sq Ft
$155/Sq Ft
Est. Value
About This Home
This home is located at 104 Derby Dr Unit III, Griffin, GA 30224 and is currently estimated at $241,640, approximately $155 per square foot. 104 Derby Dr Unit III is a home located in Spalding County with nearby schools including Orrs Elementary School, Carver Road Middle School, and Griffin High School.
Ownership History
Date
Name
Owned For
Owner Type
Purchase Details
Closed on
Nov 21, 2017
Sold by
Davis Christopher R
Bought by
Jinks Joel C
Current Estimated Value
Purchase Details
Closed on
Nov 30, 2001
Sold by
Byars Bonnie
Bought by
Davis Christopher R
Home Financials for this Owner
Home Financials are based on the most recent Mortgage that was taken out on this home.
Original Mortgage
$106,738
Interest Rate
6.59%
Mortgage Type
New Conventional
Purchase Details
Closed on
Oct 15, 1999
Sold by
Blackwell Landing Corp
Bought by
Byars Bonnie
Home Financials for this Owner
Home Financials are based on the most recent Mortgage that was taken out on this home.
Original Mortgage
$100,700
Interest Rate
7.91%
Mortgage Type
New Conventional
Purchase Details
Closed on
Feb 19, 1993
Sold by
Motift Inc
Bought by
Hawkins Partners Lp
Purchase Details
Closed on
Aug 4, 1992
Sold by
Landrum & Morris Inc
Bought by
Motift Inc
Create a Home Valuation Report for This Property
The Home Valuation Report is an in-depth analysis detailing your home's value as well as a comparison with similar homes in the area
Home Values in the Area
Average Home Value in this Area
Purchase History
| Date | Buyer | Sale Price | Title Company |
|---|---|---|---|
| Jinks Joel C | -- | -- | |
| Davis Christopher R | $106,000 | -- | |
| Byars Bonnie | $106,000 | -- | |
| Hawkins Partners Lp | $150,000 | -- | |
| Motift Inc | -- | -- |
Source: Public Records
Mortgage History
| Date | Status | Borrower | Loan Amount |
|---|---|---|---|
| Previous Owner | Davis Christopher R | $106,738 | |
| Previous Owner | Byars Bonnie | $100,700 |
Source: Public Records
Tax History Compared to Growth
Tax History
| Year | Tax Paid | Tax Assessment Tax Assessment Total Assessment is a certain percentage of the fair market value that is determined by local assessors to be the total taxable value of land and additions on the property. | Land | Improvement |
|---|---|---|---|---|
| 2024 | $2,585 | $79,629 | $9,200 | $70,429 |
| 2023 | $2,585 | $75,486 | $9,200 | $66,286 |
| 2022 | $2,491 | $62,332 | $8,000 | $54,332 |
| 2021 | $2,401 | $60,088 | $7,200 | $52,888 |
| 2020 | $1,781 | $44,562 | $7,920 | $36,642 |
| 2019 | $1,537 | $37,758 | $7,920 | $29,838 |
| 2018 | $1,534 | $36,320 | $7,920 | $28,400 |
| 2017 | $1,443 | $34,900 | $7,920 | $26,980 |
| 2016 | $1,207 | $28,747 | $7,920 | $20,827 |
| 2015 | $1,227 | $28,747 | $7,920 | $20,827 |
| 2014 | $1,264 | $28,747 | $7,920 | $20,827 |
Source: Public Records
Map
Nearby Homes
- 424 S Pine Hill Rd Unit 1
- 1723 Carrington Dr
- 1721 Carrington Dr
- 1707 Carrington Dr
- 1705 Carrington Dr
- 1850 Carrington Dr
- 1740 Summerwoods Ln
- 1663 Piedmont Rd
- 711 S Pine Hill Rd
- 117 Mixon St
- 733 S Pine Hill Rd
- 1169 W Poplar St
- 203 Ashley Dr
- 1611 Piedmont Rd
- 450 Carver
- 1610 Williamson Rd
- 1776 Cheryl Ave
- 450 Carver Rd
- 1729 Mary Ave
- 501 Oak Grove Rd
- 106 Derby Dr Unit 3
- 132 Coach Dr
- 134 Coach Dr
- 108 Derby Dr
- 1642 Carriage Hills Dr
- 107 Chariot Dr
- 1644 Carriage Hills Dr
- 103 Derby Dr
- 111 Chariot Dr
- 1640 Carriage Hills Dr
- 0 Coach Dr Unit 8368684
- 0 Coach Dr Unit 8368682
- 0 Coach Dr Unit 8377770
- 0 Coach Dr Unit 8329570
- 0 Coach Dr Unit 8284662
- 0 Coach Dr Unit 8211203
- 0 Coach Dr Unit 7614648
- 0 Coach Dr Unit 8293751
- 0 Coach Dr Unit 7350736
- 0 Coach Dr Unit 3224552