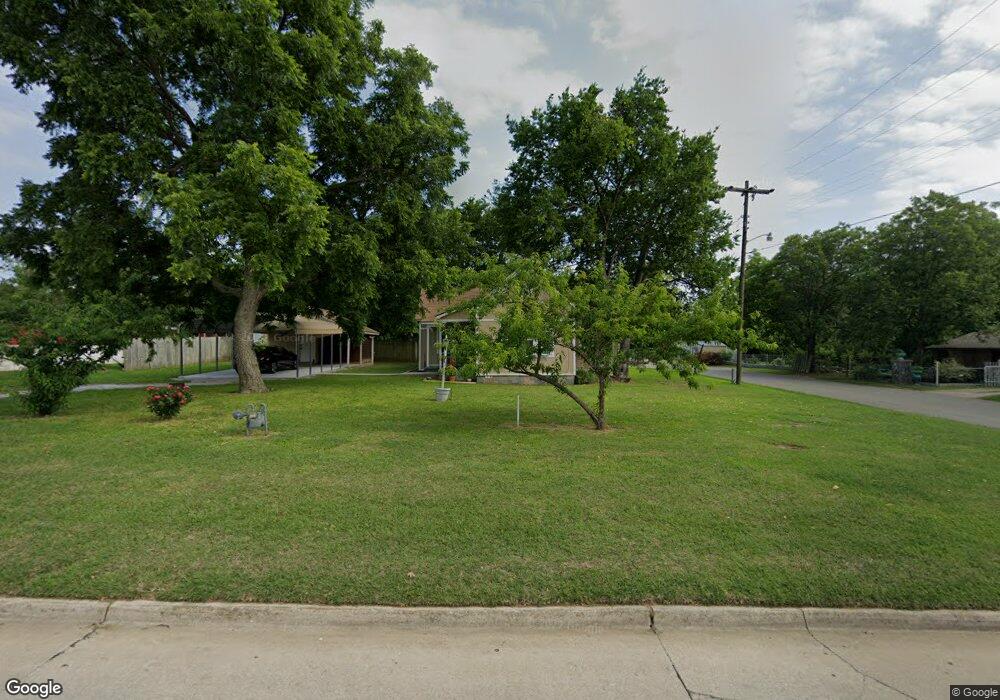
104 Drew St SW Ardmore, OK 73401
Estimated Value: $82,891 - $116,000
3
Beds
1
Bath
1,223
Sq Ft
$81/Sq Ft
Est. Value
About This Home
This home is located at 104 Drew St SW, Ardmore, OK 73401 and is currently estimated at $98,973, approximately $80 per square foot. 104 Drew St SW is a home located in Carter County with nearby schools including Lincoln Elementary School, Ardmore Middle School, and Ardmore High School.
Ownership History
Date
Name
Owned For
Owner Type
Purchase Details
Closed on
Apr 14, 2016
Sold by
Cage Elleam C
Bought by
Kidd Margaret Kay
Current Estimated Value
Purchase Details
Closed on
Nov 3, 2014
Sold by
Mccage Billy R
Bought by
Mccage Ellen N
Purchase Details
Closed on
Jan 26, 2006
Sold by
Walker Gary C and Walker Anna Jolene
Bought by
Mccage Billy Ray and Mccage Ellen N
Purchase Details
Closed on
Jun 15, 2005
Sold by
Walker Gary C and Walker Anna Jolene
Bought by
Mccage Billy K and Mccage Ellen N
Home Financials for this Owner
Home Financials are based on the most recent Mortgage that was taken out on this home.
Original Mortgage
$40,000
Interest Rate
5.76%
Mortgage Type
Unknown
Purchase Details
Closed on
Nov 7, 2002
Sold by
Heffington Jack
Bought by
Walker Gary C
Purchase Details
Closed on
Dec 11, 1997
Sold by
Caldwell Utah and Caldwell B
Bought by
Heffington Jack L
Purchase Details
Closed on
May 11, 1993
Sold by
Fenstermacher Janey B
Bought by
Caldwell Utah and Caldwell B
Create a Home Valuation Report for This Property
The Home Valuation Report is an in-depth analysis detailing your home's value as well as a comparison with similar homes in the area
Home Values in the Area
Average Home Value in this Area
Purchase History
| Date | Buyer | Sale Price | Title Company |
|---|---|---|---|
| Kidd Margaret Kay | -- | None Available | |
| Mccage Ellen N | -- | -- | |
| Mccage Billy Ray | -- | -- | |
| Mccage Billy K | $40,000 | -- | |
| Walker Gary C | $52,000 | -- | |
| Heffington Jack L | $14,000 | -- | |
| Caldwell Utah | $16,000 | -- | |
| Fenstermacher Janey B | $16,000 | -- |
Source: Public Records
Mortgage History
| Date | Status | Borrower | Loan Amount |
|---|---|---|---|
| Previous Owner | Mccage Billy K | $40,000 |
Source: Public Records
Tax History Compared to Growth
Tax History
| Year | Tax Paid | Tax Assessment Tax Assessment Total Assessment is a certain percentage of the fair market value that is determined by local assessors to be the total taxable value of land and additions on the property. | Land | Improvement |
|---|---|---|---|---|
| 2024 | $558 | $6,395 | $934 | $5,461 |
| 2023 | $538 | $6,208 | $910 | $5,298 |
| 2022 | $481 | $6,028 | $879 | $5,149 |
| 2021 | $490 | $5,852 | $820 | $5,032 |
| 2020 | $466 | $5,682 | $720 | $4,962 |
| 2019 | $438 | $5,516 | $720 | $4,796 |
| 2018 | $430 | $5,355 | $720 | $4,635 |
| 2017 | $384 | $5,200 | $720 | $4,480 |
| 2016 | $377 | $5,049 | $720 | $4,329 |
| 2015 | $311 | $5,046 | $435 | $4,611 |
| 2014 | $366 | $5,092 | $435 | $4,657 |
Source: Public Records
Map
Nearby Homes