Estimated Value: $333,000 - $382,000
4
Beds
2
Baths
1,632
Sq Ft
$222/Sq Ft
Est. Value
About This Home
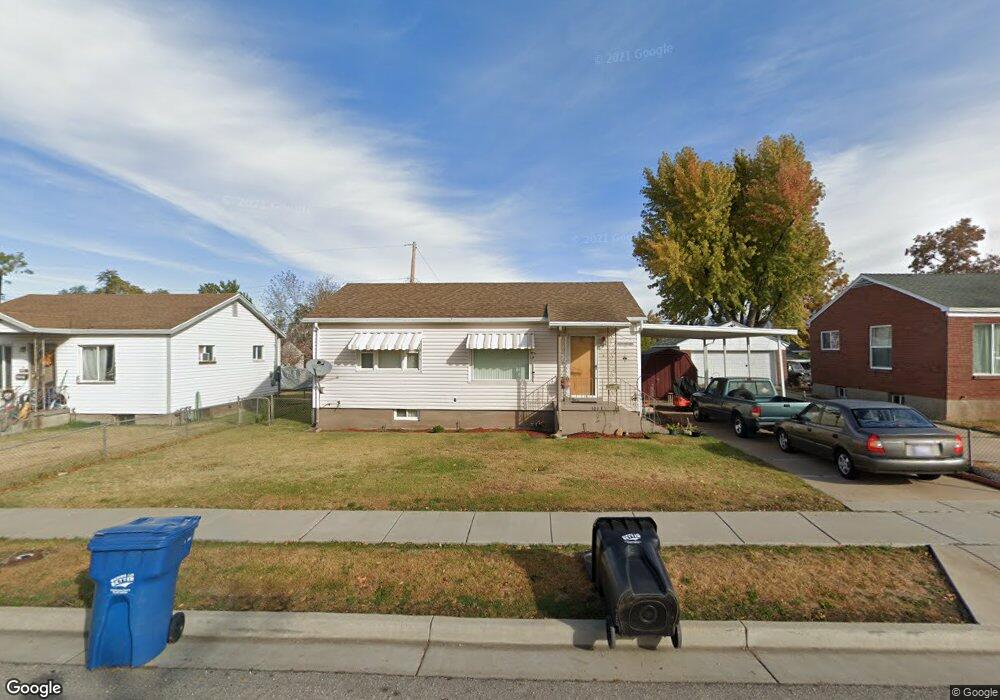
This home is located at 104 E 4800 S, Ogden, UT 84405 and is currently estimated at $362,608, approximately $222 per square foot. 104 E 4800 S is a home located in Weber County with nearby schools including Washington Terrace School, T.H. Bell Junior High School, and Bonneville High School.
Ownership History
Date
Name
Owned For
Owner Type
Purchase Details
Closed on
Jul 29, 2024
Sold by
Dodson Joann
Bought by
Love Taz Carson and Love Savannah E
Current Estimated Value
Home Financials for this Owner
Home Financials are based on the most recent Mortgage that was taken out on this home.
Original Mortgage
$313,405
Outstanding Balance
$309,913
Interest Rate
6.95%
Mortgage Type
FHA
Estimated Equity
$52,695
Purchase Details
Closed on
Aug 26, 2010
Sold by
Dodson Thomas G and Dodson Joann
Bought by
Dodson Joann and Dodson Thomas G
Home Financials for this Owner
Home Financials are based on the most recent Mortgage that was taken out on this home.
Original Mortgage
$133,693
Interest Rate
4.52%
Mortgage Type
FHA
Purchase Details
Closed on
Sep 23, 2002
Sold by
Dodson Thomas Glen and Dodson Joann
Bought by
Dodson Thomas G and Dodson Joann
Home Financials for this Owner
Home Financials are based on the most recent Mortgage that was taken out on this home.
Original Mortgage
$70,235
Interest Rate
6.16%
Create a Home Valuation Report for This Property
The Home Valuation Report is an in-depth analysis detailing your home's value as well as a comparison with similar homes in the area
Home Values in the Area
Average Home Value in this Area
Purchase History
| Date | Buyer | Sale Price | Title Company |
|---|---|---|---|
| Love Taz Carson | -- | Gt Title | |
| Dodson Joann | -- | Inwest Title Services Salt L | |
| Dodson Thomas G | -- | Backman Stewart Title |
Source: Public Records
Mortgage History
| Date | Status | Borrower | Loan Amount |
|---|---|---|---|
| Open | Love Taz Carson | $313,405 | |
| Previous Owner | Dodson Joann | $133,693 | |
| Previous Owner | Dodson Thomas G | $70,235 |
Source: Public Records
Tax History Compared to Growth
Tax History
| Year | Tax Paid | Tax Assessment Tax Assessment Total Assessment is a certain percentage of the fair market value that is determined by local assessors to be the total taxable value of land and additions on the property. | Land | Improvement |
|---|---|---|---|---|
| 2025 | $2,123 | $324,568 | $107,501 | $217,067 |
| 2024 | $2,123 | $173,249 | $59,125 | $114,124 |
| 2023 | $2,188 | $180,400 | $59,557 | $120,843 |
| 2022 | $2,290 | $196,900 | $56,893 | $140,007 |
| 2021 | $1,852 | $257,000 | $53,731 | $203,269 |
| 2020 | $1,737 | $219,000 | $44,011 | $174,989 |
| 2019 | $1,661 | $193,000 | $44,011 | $148,989 |
| 2018 | $1,414 | $158,000 | $44,011 | $113,989 |
| 2017 | $1,305 | $135,000 | $29,020 | $105,980 |
| 2016 | $1,157 | $64,083 | $16,232 | $47,851 |
| 2015 | $1,115 | $60,065 | $16,232 | $43,833 |
| 2014 | $1,072 | $57,052 | $16,232 | $40,820 |
Source: Public Records
Map
Nearby Homes