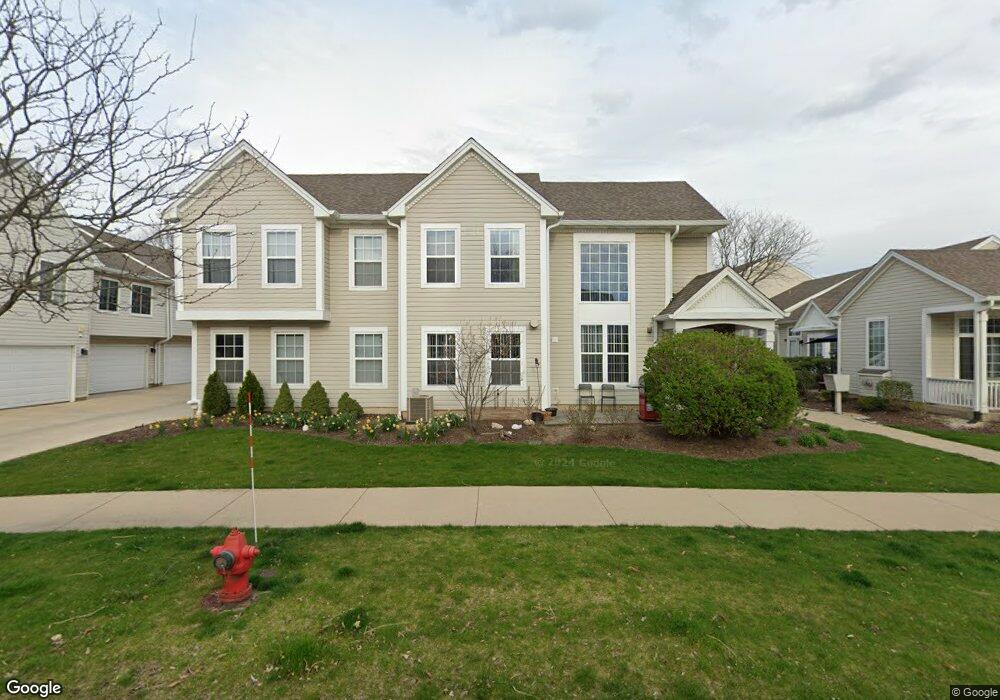
104 E Victoria Cir Unit 1 North Aurora, IL 60542
Estimated Value: $229,000 - $245,000
3
Beds
3
Baths
1,008
Sq Ft
$234/Sq Ft
Est. Value
About This Home
This home is located at 104 E Victoria Cir Unit 1, North Aurora, IL 60542 and is currently estimated at $236,256, approximately $234 per square foot. 104 E Victoria Cir Unit 1 is a home located in Kane County with nearby schools including Goodwin Elementary School, Jewel Middle School, and West Aurora High School.
Ownership History
Date
Name
Owned For
Owner Type
Purchase Details
Closed on
Jul 29, 2004
Sold by
Pegg Joshua and Hoening Amy
Bought by
Parker Carolyn K
Current Estimated Value
Home Financials for this Owner
Home Financials are based on the most recent Mortgage that was taken out on this home.
Original Mortgage
$132,525
Interest Rate
7.55%
Mortgage Type
Purchase Money Mortgage
Purchase Details
Closed on
Nov 25, 2002
Sold by
Debaggis Mary S
Bought by
Pegg Joshua and Hoening Amy
Home Financials for this Owner
Home Financials are based on the most recent Mortgage that was taken out on this home.
Original Mortgage
$124,900
Interest Rate
5%
Purchase Details
Closed on
Sep 3, 1999
Sold by
The Bigelow Group Inc
Bought by
Debaggis Mary S
Home Financials for this Owner
Home Financials are based on the most recent Mortgage that was taken out on this home.
Original Mortgage
$94,600
Interest Rate
7.59%
Create a Home Valuation Report for This Property
The Home Valuation Report is an in-depth analysis detailing your home's value as well as a comparison with similar homes in the area
Home Values in the Area
Average Home Value in this Area
Purchase History
| Date | Buyer | Sale Price | Title Company |
|---|---|---|---|
| Parker Carolyn K | $139,500 | Old Republic National Title | |
| Pegg Joshua | $131,500 | First American Title Co | |
| Debaggis Mary S | $100,000 | Inter County Title Co |
Source: Public Records
Mortgage History
| Date | Status | Borrower | Loan Amount |
|---|---|---|---|
| Previous Owner | Parker Carolyn K | $132,525 | |
| Previous Owner | Pegg Joshua | $124,900 | |
| Previous Owner | Debaggis Mary S | $94,600 |
Source: Public Records
Tax History Compared to Growth
Tax History
| Year | Tax Paid | Tax Assessment Tax Assessment Total Assessment is a certain percentage of the fair market value that is determined by local assessors to be the total taxable value of land and additions on the property. | Land | Improvement |
|---|---|---|---|---|
| 2024 | $3,697 | $56,568 | $7,184 | $49,384 |
| 2023 | $3,507 | $50,543 | $6,419 | $44,124 |
| 2022 | $3,361 | $46,116 | $5,857 | $40,259 |
| 2021 | $3,190 | $42,935 | $5,453 | $37,482 |
| 2020 | $3,723 | $48,309 | $5,065 | $43,244 |
| 2019 | $3,586 | $44,760 | $4,693 | $40,067 |
| 2018 | $3,574 | $43,345 | $4,341 | $39,004 |
| 2017 | $3,401 | $40,540 | $5,166 | $35,374 |
| 2016 | $3,325 | $38,749 | $4,428 | $34,321 |
| 2015 | -- | $33,627 | $3,808 | $29,819 |
| 2014 | -- | $31,819 | $3,140 | $28,679 |
| 2013 | -- | $31,366 | $3,095 | $28,271 |
Source: Public Records
Map
Nearby Homes
- 109 E Victoria Cir Unit 7/5
- 203 E Victoria Cir Unit 9/2
- 201 Hidden Creek Ln Unit 301
- 311 Hidden Creek Ln Unit 311
- 1202 Fox Hill Ln Unit 362
- 316 E Victoria Cir Unit 125
- 420 Hidden Creek Ln Unit 65
- 1403 Prairie Ct
- 71 Windstone Dr
- 413 Messenger Cir
- 43 S Juniper Dr Unit 3
- 1432 Hartsburg Ln Unit 1
- 1640 Abington Ln
- 438 Mallard Point Dr
- 406 Juniper Dr
- 13 Poplar Place
- 442 Mallard Point Dr
- 1 N Sycamore Ln
- 303 N Sycamore Ln
- Lot 16 West Orchard Gateway Blvd
- 102 E Victoria Cir Unit 81
- 106 E Victoria Cir Unit 8/3
- 110 E Victoria Cir Unit 8/5
- 108 E Victoria Cir Unit 84
- 112 E Victoria Cir Unit 8/6
- 105 E Victoria Cir Unit 73
- 111 E Victoria Cir Unit 76
- 107 E Victoria Cir Unit 7/4
- 103 E Victoria Cir Unit 72
- 107 E Victoria Cir Unit 107
- 101 E Victoria Cir Unit 71
- 101 E Victoria Cir Unit 101
- 201 E Victoria Cir Unit 9/1
- 207 E Victoria Cir Unit 9/4
- 205 E Victoria Cir Unit 9/3
- 202 E Victoria Cir Unit 10/1
- 202 E Victoria Cir Unit 202
- 208 E Victoria Cir Unit 104
- 206 E Victoria Cir Unit 103
- 204 E Victoria Cir Unit 2