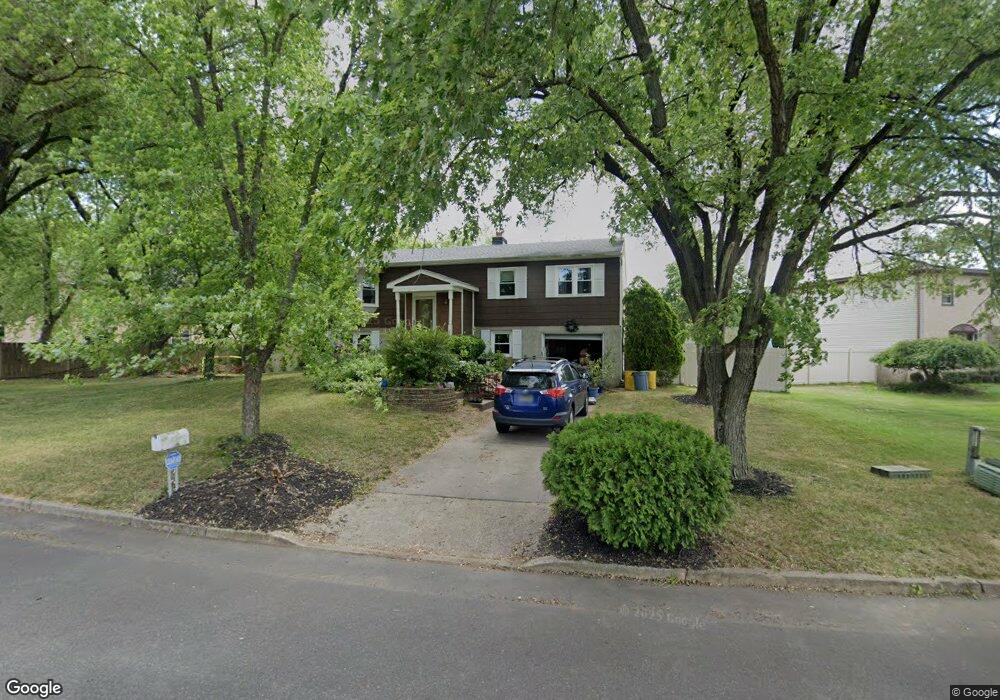
104 English Oak Dr Blackwood, NJ 08012
Washington Township NeighborhoodEstimated Value: $385,000 - $468,000
--
Bed
--
Bath
2,010
Sq Ft
$211/Sq Ft
Est. Value
About This Home
This home is located at 104 English Oak Dr, Blackwood, NJ 08012 and is currently estimated at $423,820, approximately $210 per square foot. 104 English Oak Dr is a home located in Gloucester County with nearby schools including Washington Township High School, Birches Elementary School, and Bunker Hill Middle School.
Ownership History
Date
Name
Owned For
Owner Type
Purchase Details
Closed on
Mar 8, 2011
Sold by
Kirk Patricia M and Kirk Edward V
Bought by
Kirk Patricia M and Kirk Edward V
Current Estimated Value
Home Financials for this Owner
Home Financials are based on the most recent Mortgage that was taken out on this home.
Original Mortgage
$193,162
Outstanding Balance
$132,971
Interest Rate
4.83%
Mortgage Type
FHA
Estimated Equity
$290,849
Purchase Details
Closed on
Nov 15, 2002
Sold by
Grisi J Bruce and Grisi Linda A
Bought by
Rippman James J and Krowitz Patricia
Home Financials for this Owner
Home Financials are based on the most recent Mortgage that was taken out on this home.
Original Mortgage
$150,100
Interest Rate
6.03%
Mortgage Type
Purchase Money Mortgage
Purchase Details
Closed on
Sep 17, 1994
Sold by
Grisi Ozella R
Bought by
Grisi J Bruce
Create a Home Valuation Report for This Property
The Home Valuation Report is an in-depth analysis detailing your home's value as well as a comparison with similar homes in the area
Home Values in the Area
Average Home Value in this Area
Purchase History
| Date | Buyer | Sale Price | Title Company |
|---|---|---|---|
| Kirk Patricia M | -- | Southern United Title Agency | |
| Rippman James J | $158,000 | Franklin Title Agency Inc | |
| Grisi J Bruce | -- | -- |
Source: Public Records
Mortgage History
| Date | Status | Borrower | Loan Amount |
|---|---|---|---|
| Open | Kirk Patricia M | $193,162 | |
| Closed | Rippman James J | $150,100 |
Source: Public Records
Tax History Compared to Growth
Tax History
| Year | Tax Paid | Tax Assessment Tax Assessment Total Assessment is a certain percentage of the fair market value that is determined by local assessors to be the total taxable value of land and additions on the property. | Land | Improvement |
|---|---|---|---|---|
| 2025 | $8,016 | $216,700 | $48,800 | $167,900 |
| 2024 | $7,790 | $216,700 | $48,800 | $167,900 |
| 2023 | $7,790 | $216,700 | $48,800 | $167,900 |
| 2022 | $7,535 | $216,700 | $48,800 | $167,900 |
| 2021 | $5,551 | $216,700 | $48,800 | $167,900 |
| 2020 | $7,327 | $216,700 | $48,800 | $167,900 |
| 2019 | $7,108 | $195,000 | $38,800 | $156,200 |
| 2018 | $7,028 | $195,000 | $38,800 | $156,200 |
| 2017 | $6,321 | $177,600 | $38,800 | $138,800 |
| 2016 | $6,283 | $177,600 | $38,800 | $138,800 |
| 2015 | $6,195 | $177,600 | $38,800 | $138,800 |
| 2014 | $5,999 | $177,600 | $38,800 | $138,800 |
Source: Public Records
Map
Nearby Homes
- 10 Birch Grove Ln
- 1755 Congress Dr
- 9 Samuel Adams Bldg
- 2 White Birch Ct
- 8 Charles Carroll Bldg
- 1 Matthew Thornton Bldg
- 36 Bridge Dr
- 8 John Hancock Bldg Unit 8
- 7 John Hancock Bldg Unit 7
- 323 Westminster Blvd
- 300 Westminster Blvd
- 102 Sherwood Dr
- 93 Claire Ct Unit 3
- 18 Brighton Place
- 19 Ptolemy Ct
- 13 Camelot Place
- 371 Wedgewood Dr
- 5 Kent Place
- 4 Corvas Ct
- 50 Fomalhaut Ave
- 106 English Oak Dr
- 201 Scarlet Oak Rd
- 203 Scarlet Oak Rd
- 205 Scarlet Oak Rd
- 107 English Oak Dr
- 108 English Oak Dr
- 1 Black Oak Ct
- 103 English Oak Dr
- 1 Pin Oak Ct
- 105 English Oak Dr
- 207 Scarlet Oak Rd
- 110 English Oak Dr
- 3 Black Oak Ct
- 3 Pin Oak Ct
- 109 English Oak Dr
- 209 Scarlet Oak Rd
- 9 Black Oak Ct
- 112 English Oak Dr
- 5 Black Oak Ct
- 204 Scarlet Oak Rd