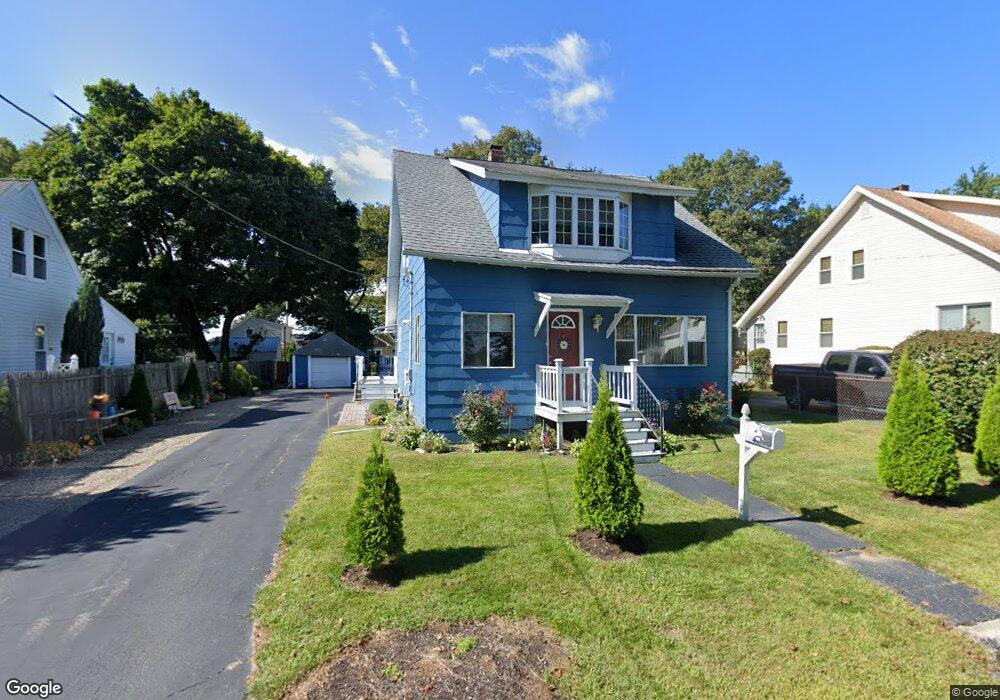
104 Epworth St Worcester, MA 01610
College Hill NeighborhoodEstimated Value: $350,000 - $386,000
3
Beds
1
Bath
1,359
Sq Ft
$272/Sq Ft
Est. Value
About This Home
This home is located at 104 Epworth St, Worcester, MA 01610 and is currently estimated at $369,955, approximately $272 per square foot. 104 Epworth St is a home located in Worcester County with nearby schools including Quinsigamond School, Jacob Hiatt Magnet School, and Chandler Magnet.
Ownership History
Date
Name
Owned For
Owner Type
Purchase Details
Closed on
Jan 10, 2005
Sold by
Cousineau David and Cousineau Vickie
Bought by
Cousineau Vickie L
Current Estimated Value
Purchase Details
Closed on
Nov 28, 1990
Sold by
Walker Richard A
Bought by
Cousineau David
Home Financials for this Owner
Home Financials are based on the most recent Mortgage that was taken out on this home.
Original Mortgage
$72,200
Interest Rate
10.16%
Mortgage Type
Purchase Money Mortgage
Create a Home Valuation Report for This Property
The Home Valuation Report is an in-depth analysis detailing your home's value as well as a comparison with similar homes in the area
Home Values in the Area
Average Home Value in this Area
Purchase History
| Date | Buyer | Sale Price | Title Company |
|---|---|---|---|
| Cousineau Vickie L | -- | -- | |
| Cousineau David | $76,000 | -- |
Source: Public Records
Mortgage History
| Date | Status | Borrower | Loan Amount |
|---|---|---|---|
| Open | Cousineau David | $105,000 | |
| Previous Owner | Cousineau David | $67,000 | |
| Previous Owner | Cousineau David | $72,200 |
Source: Public Records
Tax History
| Year | Tax Paid | Tax Assessment Tax Assessment Total Assessment is a certain percentage of the fair market value that is determined by local assessors to be the total taxable value of land and additions on the property. | Land | Improvement |
|---|---|---|---|---|
| 2025 | $4,477 | $339,400 | $117,700 | $221,700 |
| 2024 | $4,239 | $308,300 | $117,700 | $190,600 |
| 2023 | $4,057 | $282,900 | $102,300 | $180,600 |
| 2022 | $3,720 | $244,600 | $81,900 | $162,700 |
| 2021 | $3,541 | $217,500 | $65,500 | $152,000 |
| 2020 | $3,402 | $200,100 | $65,500 | $134,600 |
| 2019 | $3,272 | $181,800 | $58,900 | $122,900 |
| 2018 | $3,283 | $173,600 | $58,900 | $114,700 |
| 2017 | $3,164 | $164,600 | $58,900 | $105,700 |
| 2016 | $3,079 | $149,400 | $42,800 | $106,600 |
| 2015 | $2,998 | $149,400 | $42,800 | $106,600 |
| 2014 | $2,919 | $149,400 | $42,800 | $106,600 |
Source: Public Records
Map
Nearby Homes
Your Personal Tour Guide
Ask me questions while you tour the home.