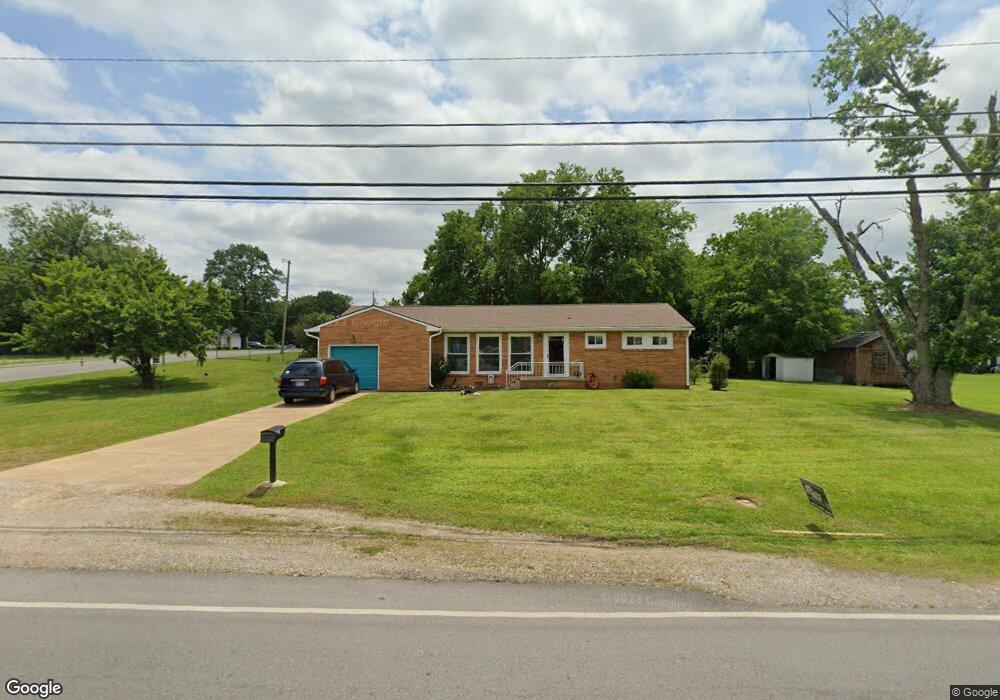
104 Forrest Rd Fort Oglethorpe, GA 30742
Estimated Value: $242,000 - $261,580
Studio
2
Baths
1,578
Sq Ft
$162/Sq Ft
Est. Value
About This Home
This home is located at 104 Forrest Rd, Fort Oglethorpe, GA 30742 and is currently estimated at $254,895, approximately $161 per square foot. 104 Forrest Rd is a home located in Catoosa County with nearby schools including Battlefield Primary School, Battlefield Elementary School, and Lakeview Middle School.
Ownership History
Date
Name
Owned For
Owner Type
Purchase Details
Closed on
Dec 9, 2015
Sold by
Miller Scotty
Bought by
Hales Bruce E and Hales Linda Sue
Current Estimated Value
Home Financials for this Owner
Home Financials are based on the most recent Mortgage that was taken out on this home.
Original Mortgage
$108,526
Outstanding Balance
$85,297
Interest Rate
4.01%
Mortgage Type
VA
Estimated Equity
$169,598
Purchase Details
Closed on
Oct 21, 2011
Sold by
Miller Larry Wilburn
Bought by
Miller Larry Wilburn
Purchase Details
Closed on
Jun 20, 2007
Sold by
Intergrity Financial Consu
Bought by
Miller Nancy O
Purchase Details
Closed on
May 1, 2007
Sold by
Faulkner Zachery Daniel
Bought by
Intergrity Financial Consultan
Purchase Details
Closed on
Feb 5, 2007
Sold by
Mccleskey Jon T
Bought by
Faulkner Zachery Daniel
Purchase Details
Closed on
Nov 1, 2002
Bought by
Mccleskey Jon T and Mccleskey Wife
Create a Home Valuation Report for This Property
The Home Valuation Report is an in-depth analysis detailing your home's value as well as a comparison with similar homes in the area
Home Values in the Area
Average Home Value in this Area
Purchase History
| Date | Buyer | Sale Price | Title Company |
|---|---|---|---|
| Hales Bruce E | $105,500 | -- | |
| Miller Larry Wilburn | -- | -- | |
| Miller Nancy O | $134,000 | -- | |
| Intergrity Financial Consultan | -- | -- | |
| Intergrity Financial Consultan | -- | -- | |
| Faulkner Zachery Daniel | -- | -- | |
| Mccleskey Jon T | $86,500 | -- |
Source: Public Records
Mortgage History
| Date | Status | Borrower | Loan Amount |
|---|---|---|---|
| Open | Hales Bruce E | $108,526 |
Source: Public Records
Tax History
| Year | Tax Paid | Tax Assessment Tax Assessment Total Assessment is a certain percentage of the fair market value that is determined by local assessors to be the total taxable value of land and additions on the property. | Land | Improvement |
|---|---|---|---|---|
| 2025 | $1,164 | $96,632 | $10,000 | $86,632 |
| 2024 | $1,347 | $92,526 | $9,702 | $82,824 |
| 2023 | $944 | $70,358 | $9,702 | $60,656 |
| 2022 | $599 | $55,738 | $9,702 | $46,036 |
| 2021 | $1,184 | $55,738 | $9,702 | $46,036 |
| 2020 | $1,442 | $48,833 | $9,702 | $39,131 |
| 2019 | $1,118 | $48,833 | $9,702 | $39,131 |
| 2018 | $1,484 | $47,361 | $8,624 | $38,737 |
| 2017 | $1,122 | $46,976 | $8,624 | $38,352 |
| 2016 | $1,355 | $41,400 | $8,624 | $32,776 |
| 2015 | -- | $41,400 | $8,624 | $32,776 |
| 2014 | -- | $41,400 | $8,624 | $32,776 |
| 2013 | -- | $41,400 | $8,624 | $32,776 |
Source: Public Records
Map
Nearby Homes
- 2 Shelby St
- 102 Forrest Rd
- 103 Robert e Lee St
- 200 Forrest Rd
- 105 Robert e Lee St
- 207 Forrest Rd
- 1 Shelby St
- 107 Robert e Lee St
- 100 Shelby St
- 100 Robert e Lee St
- 109 Robert e Lee St
- 1 Polk Ln
- 204 Forrest Rd
- 102 Robert e Lee St
- 155 Forrest Rd
- 104 Robert e Lee St
- 102 Shelby St
- 209 Forrest Rd
- 111 Robert e Lee St
- 101 Shelby St
Your Personal Tour Guide
Ask me questions while you tour the home.