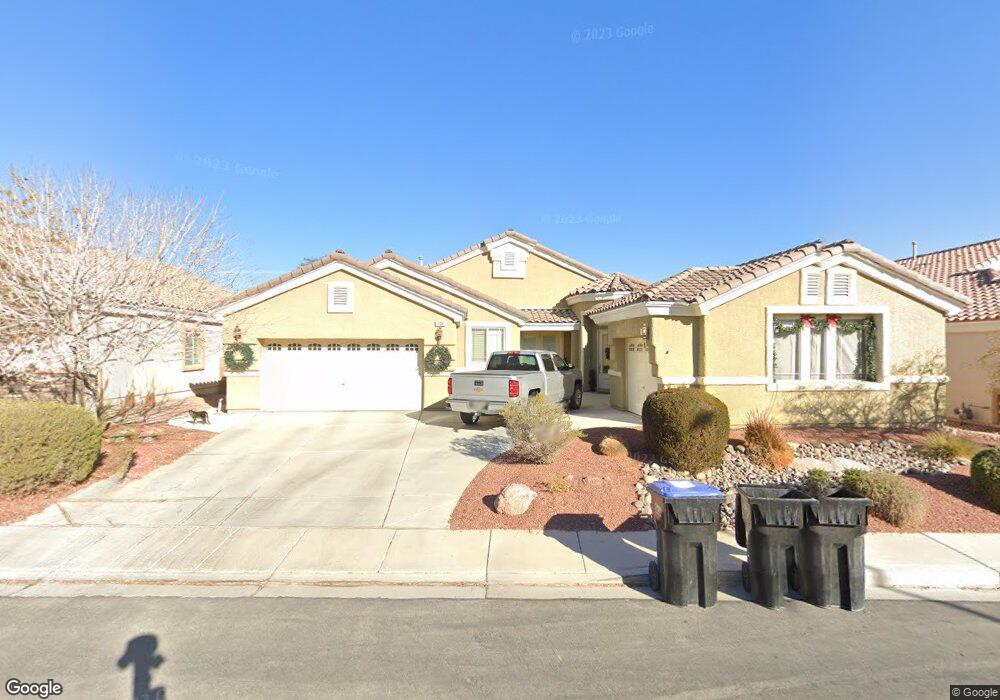
104 Fox Crossing Ave North Las Vegas, NV 89084
Aliante NeighborhoodEstimated Value: $548,000 - $655,000
4
Beds
3
Baths
2,808
Sq Ft
$222/Sq Ft
Est. Value
About This Home
This home is located at 104 Fox Crossing Ave, North Las Vegas, NV 89084 and is currently estimated at $622,502, approximately $221 per square foot. 104 Fox Crossing Ave is a home located in Clark County with nearby schools including Don E. Hayden Elementary School, Ruby Duncan Elementary School, and Brian & Teri Cram Middle School.
Ownership History
Date
Name
Owned For
Owner Type
Purchase Details
Closed on
Jul 20, 2016
Sold by
Carter Nicole M
Bought by
Carter Ryan Lee and Carter Nicole Martha
Current Estimated Value
Purchase Details
Closed on
Sep 30, 2014
Sold by
Carter Ryan L and Carter Nicole M
Bought by
Carter Nicole M
Home Financials for this Owner
Home Financials are based on the most recent Mortgage that was taken out on this home.
Original Mortgage
$210,000
Outstanding Balance
$70,416
Interest Rate
4.09%
Mortgage Type
New Conventional
Estimated Equity
$552,086
Purchase Details
Closed on
Sep 17, 2010
Sold by
Thornton David
Bought by
Carter Ryan L and Carter Nicole M
Home Financials for this Owner
Home Financials are based on the most recent Mortgage that was taken out on this home.
Original Mortgage
$182,541
Interest Rate
4.75%
Mortgage Type
FHA
Purchase Details
Closed on
Jan 15, 2007
Sold by
D R Horton Inc
Bought by
Thornton David
Home Financials for this Owner
Home Financials are based on the most recent Mortgage that was taken out on this home.
Original Mortgage
$350,124
Interest Rate
5.37%
Mortgage Type
New Conventional
Create a Home Valuation Report for This Property
The Home Valuation Report is an in-depth analysis detailing your home's value as well as a comparison with similar homes in the area
Home Values in the Area
Average Home Value in this Area
Purchase History
| Date | Buyer | Sale Price | Title Company |
|---|---|---|---|
| Carter Ryan Lee | -- | None Available | |
| Carter Nicole M | -- | None Available | |
| Carter Ryan L | $185,000 | Nevada Title Company | |
| Thornton David | $437,655 | Dhi Title |
Source: Public Records
Mortgage History
| Date | Status | Borrower | Loan Amount |
|---|---|---|---|
| Open | Carter Nicole M | $210,000 | |
| Closed | Carter Ryan L | $182,541 | |
| Previous Owner | Thornton David | $350,124 |
Source: Public Records
Tax History Compared to Growth
Tax History
| Year | Tax Paid | Tax Assessment Tax Assessment Total Assessment is a certain percentage of the fair market value that is determined by local assessors to be the total taxable value of land and additions on the property. | Land | Improvement |
|---|---|---|---|---|
| 2025 | $3,703 | $245,141 | $40,950 | $204,191 |
| 2024 | $3,595 | $245,141 | $40,950 | $204,191 |
| 2023 | $2,900 | $226,983 | $36,400 | $190,583 |
| 2022 | $3,491 | $204,670 | $31,500 | $173,170 |
| 2021 | $3,389 | $178,102 | $27,300 | $150,802 |
| 2020 | $3,406 | $176,264 | $26,950 | $149,314 |
| 2019 | $3,248 | $172,317 | $25,550 | $146,767 |
| 2018 | $3,099 | $146,404 | $21,000 | $125,404 |
| 2017 | $4,671 | $139,244 | $18,900 | $120,344 |
| 2016 | $2,900 | $115,021 | $15,400 | $99,621 |
| 2015 | $2,447 | $101,139 | $14,000 | $87,139 |
| 2014 | $2,375 | $74,200 | $10,500 | $63,700 |
Source: Public Records
Map
Nearby Homes
- 7175 Steubling Glen St
- 0 N Commerce St
- 7114 Superstar St
- 333 Largo Vista Ct
- 37 Buffalo Gap Ct
- 6940 Whispering Falls Dr
- 410 Horse Pointe Ave
- 128 Pollentia Ave
- 105 Pollentia Ave
- 6643 Montezuma Castle Ln
- 6729 Montezuma Castle Ln
- 6738 Cinnabar Coast Ln
- 984 Brilliant Meadow Ave
- 336 River Glider Ave
- 1010 Belton Lake Ave
- 1009 Belton Lake Ave
- 7056 Port Stephens St
- 7060 Port Stephens St
- 7064 Port Stephens St
- 7052 Port Stephens St
- 108 Fox Crossing Ave
- 92 Fox Crossing Ave
- 109 Elks Peak Ave
- 105 Elks Peak Ave
- 112 Fox Crossing Ave
- 113 Elks Peak Ave
- 88 Fox Crossing Ave
- 95 Elks Peak Ave
- 105 Fox Crossing Ave
- 109 Fox Crossing Ave
- 117 Elks Peak Ave
- 95 Fox Crossing Ave
- 91 Elks Peak Ave
- 116 Fox Crossing Ave
- 84 Fox Crossing Ave
- 113 Fox Crossing Ave
- 91 Fox Crossing Ave
- 121 Elks Peak Ave
- 87 Elks Peak Ave
- 117 Fox Crossing Ave