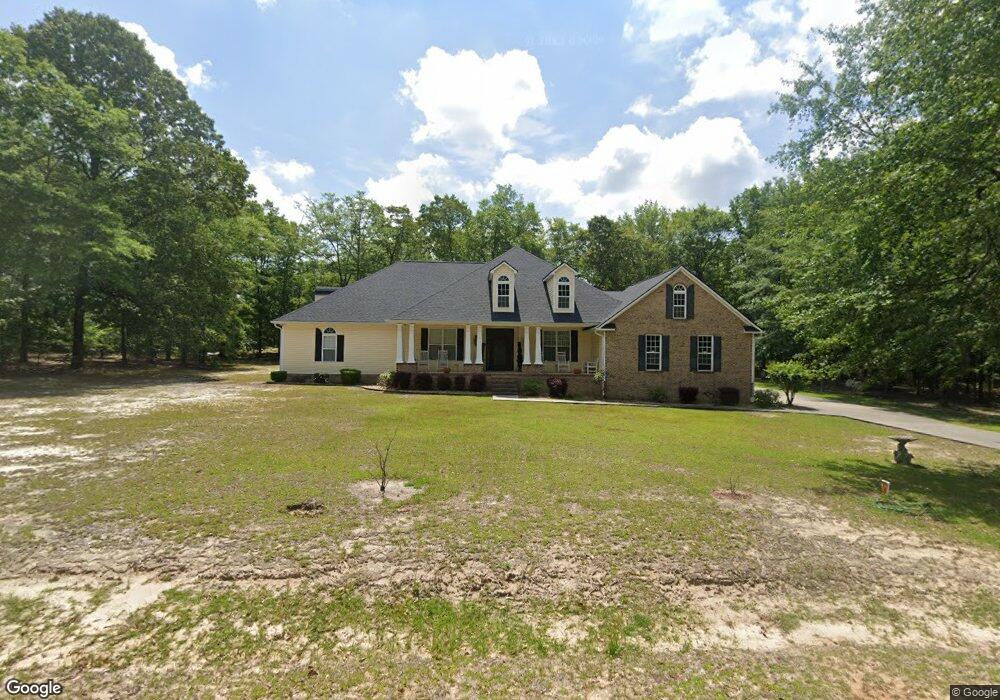
104 Franklin St Gordon, GA 31031
Estimated Value: $278,000 - $323,461
3
Beds
3
Baths
2,697
Sq Ft
$111/Sq Ft
Est. Value
About This Home
This home is located at 104 Franklin St, Gordon, GA 31031 and is currently estimated at $300,487, approximately $111 per square foot. 104 Franklin St is a home located in Wilkinson County with nearby schools including Wilkinson County Primary School, Wilkinson County Elementary School, and Wilkinson County Middle School.
Ownership History
Date
Name
Owned For
Owner Type
Purchase Details
Closed on
Sep 10, 2024
Sold by
Richardson Cynthia B
Bought by
Richardson Ronald K
Current Estimated Value
Purchase Details
Closed on
May 9, 2022
Sold by
Richardson Ronald K
Bought by
Richardson Ronald K and Richardson Cynthia B
Purchase Details
Closed on
Feb 28, 2006
Sold by
Richardson Robert L
Bought by
Richardson Ronald K
Home Financials for this Owner
Home Financials are based on the most recent Mortgage that was taken out on this home.
Original Mortgage
$139,308
Interest Rate
6.19%
Mortgage Type
FHA
Purchase Details
Closed on
Nov 20, 2002
Sold by
Richardson Keith
Bought by
Richardson Robert L and Mamie Richard
Purchase Details
Closed on
Mar 16, 2001
Sold by
Whipple Lasonya
Bought by
Richardson Keith
Purchase Details
Closed on
May 5, 1998
Bought by
Richardson Richardson and Richardson Whipple
Create a Home Valuation Report for This Property
The Home Valuation Report is an in-depth analysis detailing your home's value as well as a comparison with similar homes in the area
Purchase History
| Date | Buyer | Sale Price | Title Company |
|---|---|---|---|
| Richardson Ronald K | -- | -- | |
| Richardson Ronald K | -- | -- | |
| Richardson Ronald K | $141,500 | -- | |
| Richardson Robert L | -- | -- | |
| Richardson Keith | -- | -- | |
| Richardson Richardson | $5,000 | -- |
Source: Public Records
Mortgage History
| Date | Status | Borrower | Loan Amount |
|---|---|---|---|
| Previous Owner | Richardson Ronald K | $139,308 |
Source: Public Records
Tax History
| Year | Tax Paid | Tax Assessment Tax Assessment Total Assessment is a certain percentage of the fair market value that is determined by local assessors to be the total taxable value of land and additions on the property. | Land | Improvement |
|---|---|---|---|---|
| 2025 | $4,515 | $125,477 | $3,346 | $122,131 |
| 2024 | $4,526 | $125,477 | $3,346 | $122,131 |
| 2023 | $3,321 | $82,138 | $1,972 | $80,166 |
| 2022 | $3,321 | $82,138 | $1,972 | $80,166 |
| 2021 | $3,365 | $82,138 | $1,972 | $80,166 |
| 2020 | $3,318 | $82,138 | $1,972 | $80,166 |
| 2019 | $3,318 | $82,138 | $1,972 | $80,166 |
| 2018 | $3,302 | $75,963 | $1,972 | $73,991 |
| 2017 | $2,787 | $75,963 | $1,972 | $73,991 |
| 2016 | $2,787 | $75,963 | $1,972 | $73,991 |
| 2015 | $2,684 | $75,962 | $1,972 | $73,991 |
| 2014 | $2,684 | $75,963 | $1,972 | $73,991 |
| 2013 | $2,684 | $75,962 | $1,972 | $73,990 |
Source: Public Records
Map
Nearby Homes
- 121 Elm St
- 106 Sarah Kate Way
- 152 Main St
- 189 Pine St
- 180 N Main St
- 160 College St
- 193 Elam St
- 114 Hardie St
- 108 Sitton Ave
- 0 Ballpark Rd
- 116 Tasha Rd
- 0 Dennard Hardy Rd Unit 10460790
- 110 Briarcliff Trail
- 0 Highway 57 Unit 261084
- 140 Chickasaw Dr
- 470/510 Ivey Farms Dr
- 0 Snowhill Church Rd Unit 26631642
- 0 Snowhill Church Rd Unit LOT D-11
- 2140 Nesmith Rd
- 56 Claymont Rd
- 137 Elm St
- 107 Franklin St
- 134 Elm St
- 136 Elm St
- 132 Elm St
- 148 Harberson Walker Rd
- 146 Harberson Walker Rd
- 128 Elm St
- 150 Harberson Walker Rd
- 152 Harberson Walker Rd
- 108 Harbinson Walker Rd
- - -
- 0 - Unit 159216
- 0 - Unit 159217
- 143 Harberson Walker Rd
- 140 Harbison Walker Road (Aka Popl St
- 126 Elm St
- 129 Elm St
- 141 Harberson Walker Rd
- 140 Harberson Walker Rd
Your Personal Tour Guide
Ask me questions while you tour the home.