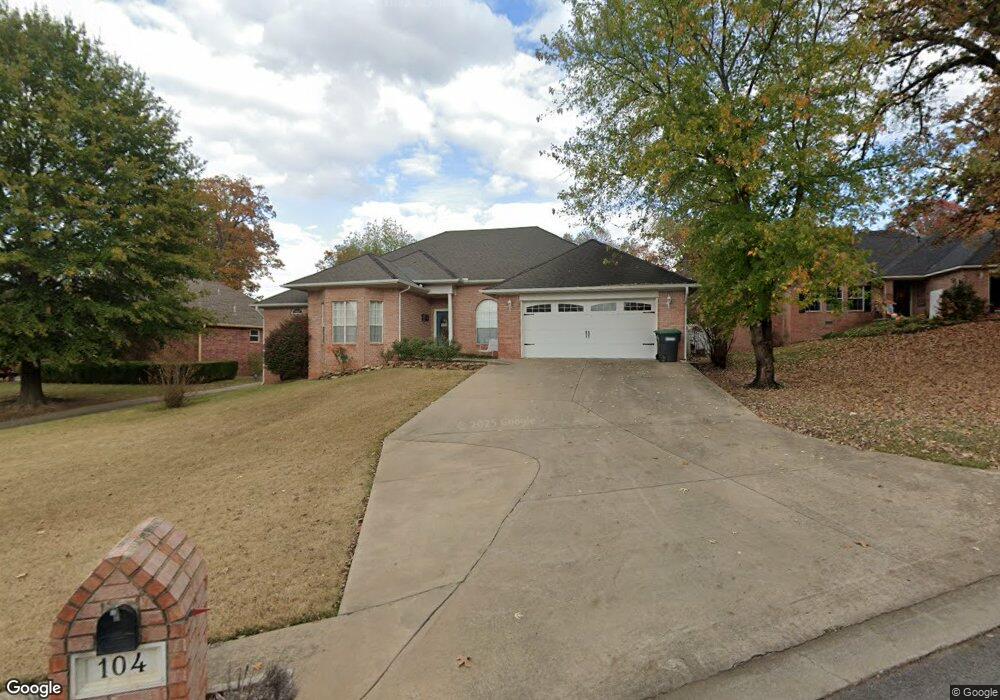
104 Greentree Dr Tahlequah, OK 74464
Estimated Value: $300,000 - $333,000
4
Beds
3
Baths
2,458
Sq Ft
$127/Sq Ft
Est. Value
About This Home
This home is located at 104 Greentree Dr, Tahlequah, OK 74464 and is currently estimated at $312,761, approximately $127 per square foot. 104 Greentree Dr is a home located in Cherokee County with nearby schools including Greenwood Elementary School, Cherokee Elementary School, and Tahlequah Middle School.
Ownership History
Date
Name
Owned For
Owner Type
Purchase Details
Closed on
Aug 31, 2025
Sold by
Young Cherissa and Young Robert
Bought by
Young Robert
Current Estimated Value
Purchase Details
Closed on
Nov 1, 2006
Sold by
Criminger Bobby J and Criminger Jacquelyn A
Bought by
Young Robert and Young Cherissa
Home Financials for this Owner
Home Financials are based on the most recent Mortgage that was taken out on this home.
Original Mortgage
$39,500
Interest Rate
6.37%
Mortgage Type
Seller Take Back
Purchase Details
Closed on
Jul 14, 2004
Sold by
Jon and Laura James
Bought by
Bobby Criminger
Purchase Details
Closed on
Jun 14, 2000
Sold by
Troy and Lillie Manes
Bought by
James Jon B and James Laura L
Purchase Details
Closed on
Sep 21, 1999
Sold by
Scott and Tommy Wright
Bought by
Troy and Lillie Manes
Purchase Details
Closed on
Aug 11, 1993
Sold by
Scott and Wright Tommy S
Bought by
Herb and Rozell Carol M
Create a Home Valuation Report for This Property
The Home Valuation Report is an in-depth analysis detailing your home's value as well as a comparison with similar homes in the area
Home Values in the Area
Average Home Value in this Area
Purchase History
| Date | Buyer | Sale Price | Title Company |
|---|---|---|---|
| Young Robert | -- | Fidelity National Title | |
| Young Robert | -- | Fidelity National Title | |
| Young Robert | $197,500 | Tahlequah Abstract Closing S | |
| Bobby Criminger | $165,000 | -- | |
| James Jon B | $155,000 | -- | |
| Troy | $28,000 | -- | |
| Herb | $10,000 | -- |
Source: Public Records
Mortgage History
| Date | Status | Borrower | Loan Amount |
|---|---|---|---|
| Previous Owner | Young Robert | $39,500 |
Source: Public Records
Tax History Compared to Growth
Tax History
| Year | Tax Paid | Tax Assessment Tax Assessment Total Assessment is a certain percentage of the fair market value that is determined by local assessors to be the total taxable value of land and additions on the property. | Land | Improvement |
|---|---|---|---|---|
| 2025 | $2,371 | $26,276 | $2,750 | $23,526 |
| 2024 | $2,371 | $25,025 | $2,619 | $22,406 |
| 2023 | $2,371 | $23,833 | $2,200 | $21,633 |
| 2022 | $2,211 | $23,833 | $2,200 | $21,633 |
| 2021 | $2,219 | $23,833 | $2,200 | $21,633 |
| 2020 | $2,259 | $23,833 | $2,200 | $21,633 |
| 2019 | $2,239 | $23,833 | $2,200 | $21,633 |
| 2018 | $2,406 | $25,308 | $2,200 | $23,108 |
| 2017 | $2,386 | $25,149 | $2,186 | $22,963 |
| 2016 | $2,287 | $23,952 | $1,852 | $22,100 |
| 2015 | $2,045 | $22,811 | $2,016 | $20,795 |
| 2014 | $2,045 | $21,725 | $1,846 | $19,879 |
Source: Public Records
Map
Nearby Homes
- 200 Remington Place
- 103 S Harrison Ave
- 104 Tommye Ln
- 101 S Harrison Ave
- 0 S Hwy 82 A Hwy Unit 2532332
- 111 N Logan Dr
- 605 S Oak Ave
- 508 Covington Place
- 720 S East Ave
- 215 S Maple Ave
- 1025 E Downing St
- 609 E Ward St
- 725 Sooner Dr
- 605 E Ward St
- 403 S Bluff Ave
- 413 Greenwood Dr
- 1005 Kaufman Ave
- 702 Wilson Ave
- 640 N Oklahoma Ave
- 201 Sandy Cir
- 205 S Harrison Ave
- 102 Greentree Dr
- 116 S Harrison Ave
- 100 S Harrison Ave
- 105 Remington Place
- 203 S Harrison Ave
- 99 Greentree Dr
- 107 Remington Place
- 103 Remington Place
- null Greentree Dr
- 200 Greentree Dr
- 109 Remington Place
- 201 S Harrison Ave
- 201 Greentree Dr
- 101 Remington Place
- 111 Remington Place
- 206 Remington Place
- 112 S Harrison Ave
- 104 Remington Place
- 203 Greentree Dr