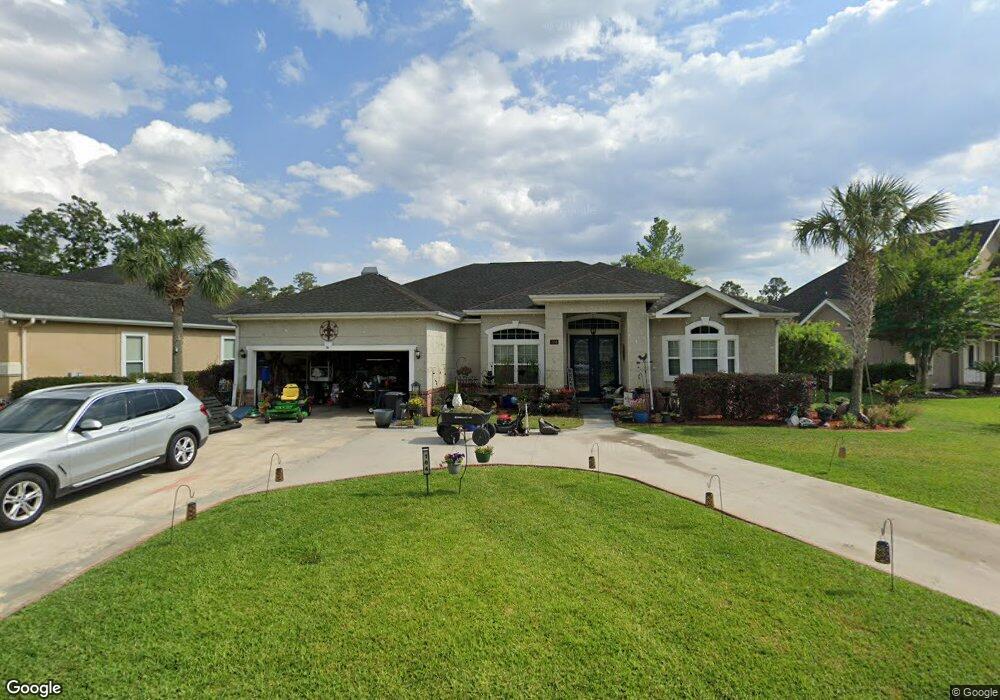
104 Herons Nest Cir Kingsland, GA 31548
Estimated Value: $440,000 - $462,000
4
Beds
3
Baths
2,636
Sq Ft
$173/Sq Ft
Est. Value
About This Home
This home is located at 104 Herons Nest Cir, Kingsland, GA 31548 and is currently estimated at $454,798, approximately $172 per square foot. 104 Herons Nest Cir is a home located in Camden County with nearby schools including Sugarmill Elementary School, Saint Marys Middle School, and Camden County High School.
Ownership History
Date
Name
Owned For
Owner Type
Purchase Details
Closed on
Apr 16, 2018
Sold by
Barone Vincent M
Bought by
Thompson George T and Kahanek Thompso Melissa S
Current Estimated Value
Home Financials for this Owner
Home Financials are based on the most recent Mortgage that was taken out on this home.
Original Mortgage
$259,461
Outstanding Balance
$223,132
Interest Rate
4.44%
Mortgage Type
VA
Estimated Equity
$231,666
Purchase Details
Closed on
Apr 11, 2006
Sold by
Not Provided
Bought by
Barone Vincent M and Barone Deana M
Home Financials for this Owner
Home Financials are based on the most recent Mortgage that was taken out on this home.
Original Mortgage
$328,703
Interest Rate
6.31%
Mortgage Type
New Conventional
Purchase Details
Closed on
Aug 3, 2005
Sold by
Neighborhoods Of Laurel
Bought by
Distinctive Design Homes Llc
Home Financials for this Owner
Home Financials are based on the most recent Mortgage that was taken out on this home.
Original Mortgage
$250,000
Interest Rate
5.57%
Mortgage Type
New Conventional
Create a Home Valuation Report for This Property
The Home Valuation Report is an in-depth analysis detailing your home's value as well as a comparison with similar homes in the area
Home Values in the Area
Average Home Value in this Area
Purchase History
| Date | Buyer | Sale Price | Title Company |
|---|---|---|---|
| Thompson George T | $254,000 | -- | |
| Barone Vincent M | $340,860 | -- | |
| Distinctive Design Homes Llc | $64,505 | -- |
Source: Public Records
Mortgage History
| Date | Status | Borrower | Loan Amount |
|---|---|---|---|
| Open | Thompson George T | $259,461 | |
| Previous Owner | Barone Vincent M | $328,703 | |
| Previous Owner | Distinctive Design Homes Llc | $250,000 |
Source: Public Records
Tax History Compared to Growth
Tax History
| Year | Tax Paid | Tax Assessment Tax Assessment Total Assessment is a certain percentage of the fair market value that is determined by local assessors to be the total taxable value of land and additions on the property. | Land | Improvement |
|---|---|---|---|---|
| 2024 | $4,617 | $133,874 | $14,000 | $119,874 |
| 2023 | $4,657 | $129,874 | $10,000 | $119,874 |
| 2022 | $4,439 | $124,171 | $10,000 | $114,171 |
| 2021 | $4,123 | $107,593 | $10,000 | $97,593 |
| 2020 | $3,972 | $99,823 | $12,000 | $87,823 |
| 2019 | $3,972 | $99,823 | $12,000 | $87,823 |
| 2018 | $813 | $99,823 | $12,000 | $87,823 |
| 2017 | $3,362 | $92,427 | $12,000 | $80,427 |
| 2016 | $2,573 | $89,942 | $12,000 | $77,942 |
| 2015 | $3,211 | $89,942 | $12,000 | $77,942 |
| 2014 | $3,200 | $89,942 | $12,000 | $77,942 |
Source: Public Records
Map
Nearby Homes
- 102 Herons Nest Cir
- 0 Woodstork Place Unit 10495332
- 0 Woodstork Place Unit 1653118
- 151 Laurel Marsh Way
- 103 Renee Dr
- 112 Justin Cole Dr
- 89 Amanda Trace
- 121 Kathryne Bailey Dr
- 204 Laurel Landing Blvd
- 107 Amanda Trc
- 125 Fiddlers Cove Dr
- 113 Amanda Trace
- 136 Bryce Ryan Cir
- 132 Brookshire Green Ct
- 138 Amanda Trace
- 121 Amanda Trace
- Drexel Plan at Brookshire Green
- Huntington Plan at Brookshire Green
- Wilmington Plan at Brookshire Green
- The Naples Plan at Brookshire Green
- 106 Herons Nest Cir
- 0 Heron's Nest Cir
- 108 Herons Nest Cir
- 101 Lake View Ct
- 105 Heron's Nest Cir
- 102 Laurel Marsh Way
- 110 Herons Nest Cir
- 105 Herons Nest Cir
- 103 Herons Nest Cir
- 109 Herons Nest Cir
- 100 Laurel Marsh Way
- 100 Laurel Marsh Way Unit 97
- 100 Lake View Ct
- 103 Lake View Ct
- 103 Lake View Ct
- 112 Herons Nest Cir
- 111 Herons Nest Cir
- 0 Lake View Ct Unit 7300060
- 0 Lake View Ct Unit 7088752
- 0 Lake View Ct Unit 8461303