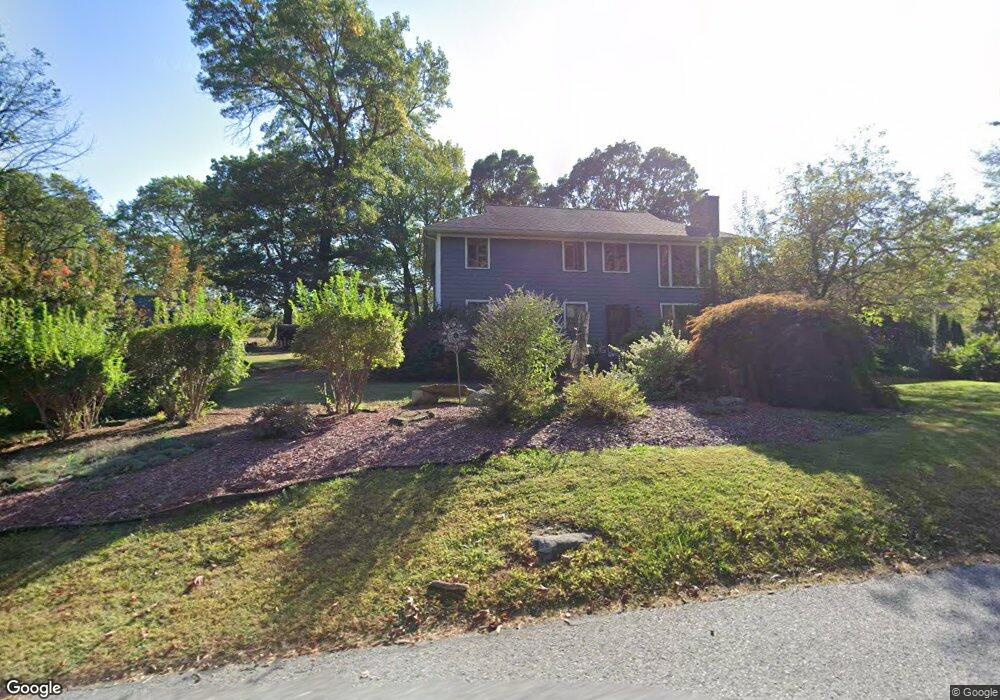
104 Hobbs Rd Princeton, MA 01541
Estimated Value: $666,000 - $772,000
5
Beds
3
Baths
2,608
Sq Ft
$272/Sq Ft
Est. Value
About This Home
This home is located at 104 Hobbs Rd, Princeton, MA 01541 and is currently estimated at $708,683, approximately $271 per square foot. 104 Hobbs Rd is a home located in Worcester County with nearby schools including Wachusett Regional High School.
Ownership History
Date
Name
Owned For
Owner Type
Purchase Details
Closed on
Nov 27, 2006
Sold by
Hillis James W
Bought by
Hillis James W and Hillis Raquel E
Current Estimated Value
Home Financials for this Owner
Home Financials are based on the most recent Mortgage that was taken out on this home.
Original Mortgage
$417,000
Interest Rate
6.39%
Mortgage Type
Purchase Money Mortgage
Purchase Details
Closed on
Aug 25, 1998
Sold by
Hillis James W and Hillis Diane J
Bought by
Hillis James W
Purchase Details
Closed on
Jun 21, 1994
Sold by
Sawicki Diane J and Hillis James
Bought by
Hillis James W
Purchase Details
Closed on
Oct 4, 1993
Sold by
Prudential Home Mtg In
Bought by
Sawicki Diane and Hillis James
Purchase Details
Closed on
Oct 16, 1992
Sold by
Dawson Lisa N
Bought by
First Trust Natl Assoc
Create a Home Valuation Report for This Property
The Home Valuation Report is an in-depth analysis detailing your home's value as well as a comparison with similar homes in the area
Home Values in the Area
Average Home Value in this Area
Purchase History
| Date | Buyer | Sale Price | Title Company |
|---|---|---|---|
| Hillis James W | -- | -- | |
| Hillis James W | $22,000 | -- | |
| Hillis James W | $15,000 | -- | |
| Sawicki Diane | $163,000 | -- | |
| First Trust Natl Assoc | $267,750 | -- |
Source: Public Records
Mortgage History
| Date | Status | Borrower | Loan Amount |
|---|---|---|---|
| Open | First Trust Natl Assoc | $410,000 | |
| Closed | Hillis James W | $417,000 | |
| Closed | Hillis James W | $10,000 | |
| Previous Owner | First Trust Natl Assoc | $80,000 |
Source: Public Records
Tax History Compared to Growth
Tax History
| Year | Tax Paid | Tax Assessment Tax Assessment Total Assessment is a certain percentage of the fair market value that is determined by local assessors to be the total taxable value of land and additions on the property. | Land | Improvement |
|---|---|---|---|---|
| 2025 | $8,164 | $561,892 | $147,092 | $414,800 |
| 2024 | $7,574 | $539,861 | $145,261 | $394,600 |
| 2023 | $7,020 | $463,646 | $116,946 | $346,700 |
| 2022 | $6,765 | $431,441 | $116,241 | $315,200 |
| 2021 | $8,496 | $428,241 | $116,241 | $312,000 |
| 2020 | $6,688 | $421,941 | $116,241 | $305,700 |
| 2019 | $6,652 | $415,200 | $112,700 | $302,500 |
| 2018 | $7,374 | $351,287 | $93,487 | $257,800 |
| 2017 | $49 | $301,900 | $138,400 | $163,500 |
| 2016 | $5,363 | $301,300 | $137,800 | $163,500 |
| 2015 | $5,225 | $302,000 | $140,300 | $161,700 |
Source: Public Records
Map
Nearby Homes
- 161 Beaman Rd
- 193 Justice Hill Road Cutoff
- 47 Pine Hill Rd
- 46 Pine Hill Rd
- 1180 Elm St Unit Willow
- 100 Houghton Rd
- 20 Wachusett Dr
- 11 Mirick Rd
- 134 Mountain Rd
- 28 Merriam Rd
- 58 Merriam Rd
- LOT 1 Elm St
- 3 Woods Rd
- 19 Hardscrabble Rd
- 62 Bolton Rd Unit Applewood
- 20 Mountain Rd
- 871 Pleasant St
- 20 Town Farm Rd
- 17 Coal Kiln Rd
- 41 Hill St