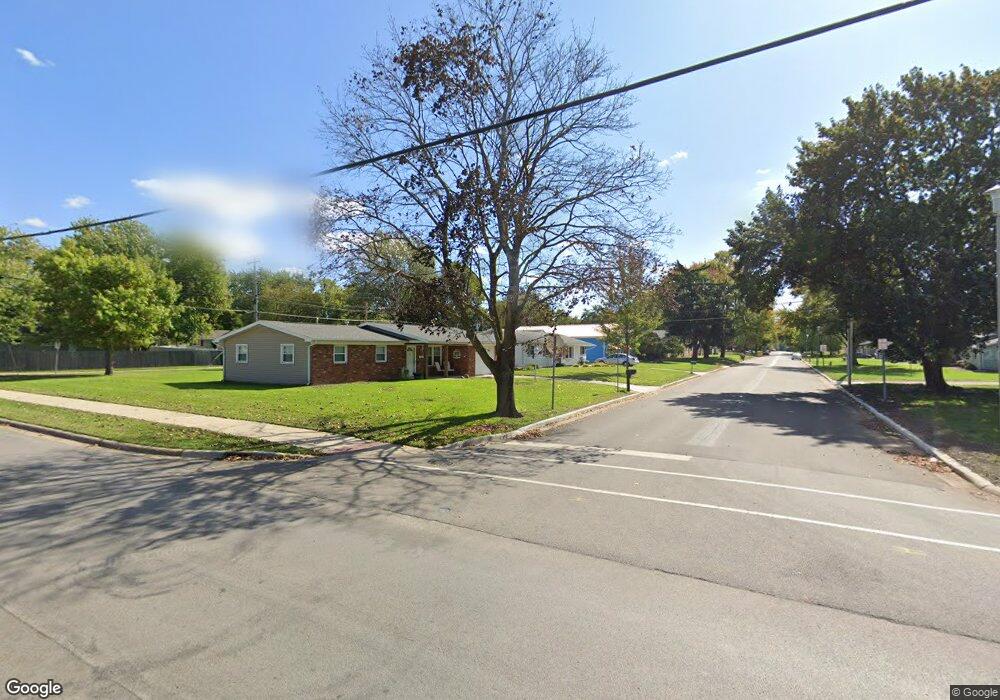
104 Iwo St Auburn, IN 46706
Estimated Value: $195,000 - $230,000
3
Beds
1
Bath
1,728
Sq Ft
$121/Sq Ft
Est. Value
About This Home
This home is located at 104 Iwo St, Auburn, IN 46706 and is currently estimated at $209,371, approximately $121 per square foot. 104 Iwo St is a home located in DeKalb County with nearby schools including DeKalb High School and Lakewood Park Christian School.
Ownership History
Date
Name
Owned For
Owner Type
Purchase Details
Closed on
Jun 11, 2018
Sold by
Holbrook Michael J and Holbrook Shasta M
Bought by
Snodderly Mark E and Snodderly Stacie E
Current Estimated Value
Home Financials for this Owner
Home Financials are based on the most recent Mortgage that was taken out on this home.
Original Mortgage
$129,125
Outstanding Balance
$111,671
Interest Rate
4.5%
Mortgage Type
VA
Estimated Equity
$97,700
Purchase Details
Closed on
Oct 16, 2007
Sold by
Snodderly Matthew
Bought by
Snodderly Mark E and Snodderly Stacie E
Purchase Details
Closed on
Apr 18, 2001
Sold by
First Bank National Association Tr
Bought by
Snodderly Matthew
Purchase Details
Closed on
Nov 8, 2000
Sold by
Hall George E and Hall Deborah K
Bought by
First Bank National Association Tr
Create a Home Valuation Report for This Property
The Home Valuation Report is an in-depth analysis detailing your home's value as well as a comparison with similar homes in the area
Home Values in the Area
Average Home Value in this Area
Purchase History
| Date | Buyer | Sale Price | Title Company |
|---|---|---|---|
| Snodderly Mark E | -- | None Available | |
| Snodderly Mark E | -- | None Available | |
| Snodderly Matthew | $78,000 | -- | |
| First Bank National Association Tr | -- | -- |
Source: Public Records
Mortgage History
| Date | Status | Borrower | Loan Amount |
|---|---|---|---|
| Open | Snodderly Mark E | $129,125 |
Source: Public Records
Tax History Compared to Growth
Tax History
| Year | Tax Paid | Tax Assessment Tax Assessment Total Assessment is a certain percentage of the fair market value that is determined by local assessors to be the total taxable value of land and additions on the property. | Land | Improvement |
|---|---|---|---|---|
| 2024 | $1,064 | $152,900 | $23,700 | $129,200 |
| 2023 | $895 | $140,800 | $21,600 | $119,200 |
| 2022 | $1,053 | $141,700 | $21,400 | $120,300 |
| 2021 | $896 | $124,100 | $20,200 | $103,900 |
| 2020 | $749 | $112,400 | $18,400 | $94,000 |
| 2019 | $677 | $105,000 | $18,400 | $86,600 |
| 2018 | $571 | $93,600 | $18,400 | $75,200 |
| 2017 | $527 | $89,400 | $18,400 | $71,000 |
| 2016 | $508 | $86,800 | $18,400 | $68,400 |
| 2014 | $478 | $80,700 | $16,600 | $64,100 |
Source: Public Records
Map
Nearby Homes
- 812 E 9th St
- 218 Iwo St
- 271 N Mcclellan St Unit 105
- 300 E 7th St
- 410 N Cedar St
- 1501 Foley Ct
- 1102 Packard Place
- 904 Elm St
- 603 Roselawn Ct
- 0 Smith Dr
- 1208 Phaeton Way
- 1011 Elm St
- 3483 Indiana 8
- 1408 Duesenberg Dr
- 1604 Allison Blvd
- 303 Hunters Ridge
- 901 S Van Buren St
- 106 Fox Trail Dr
- 343 W 11th St
- 350 W 9th St