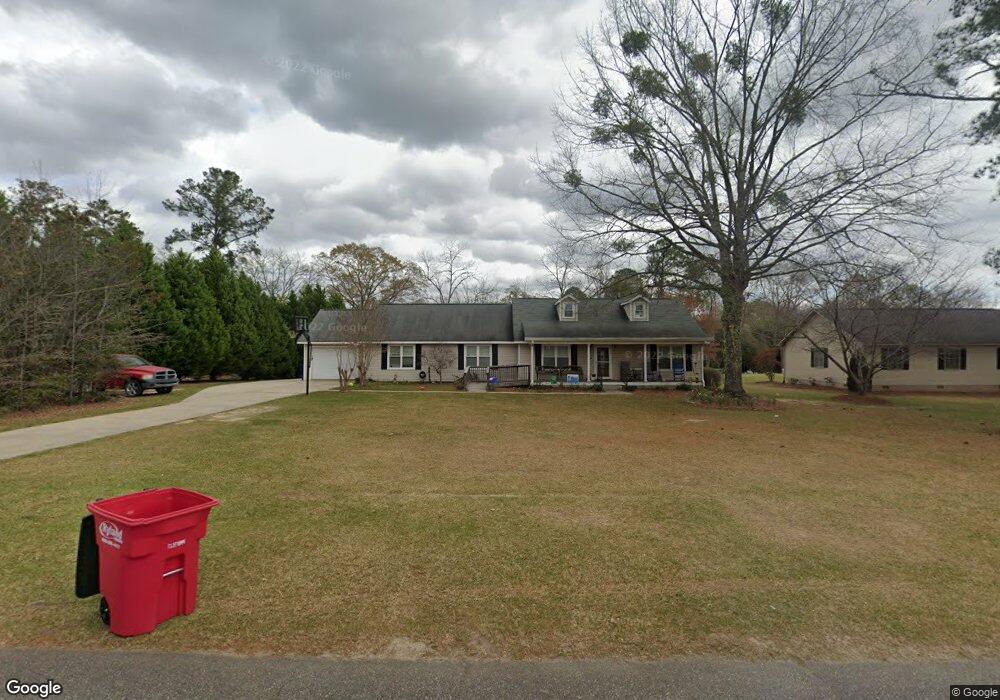
104 J Dr S Macon, GA 31216
Estimated Value: $270,271 - $308,000
4
Beds
2
Baths
2,048
Sq Ft
$140/Sq Ft
Est. Value
About This Home
This home is located at 104 J Dr S, Macon, GA 31216 and is currently estimated at $286,068, approximately $139 per square foot. 104 J Dr S is a home located in Bibb County with nearby schools including Heard Elementary School, Rutland Middle School, and Rutland High School.
Ownership History
Date
Name
Owned For
Owner Type
Purchase Details
Closed on
Jun 19, 2013
Sold by
Carpenter Chessie B
Bought by
Saylor Gina C
Current Estimated Value
Home Financials for this Owner
Home Financials are based on the most recent Mortgage that was taken out on this home.
Original Mortgage
$113,500
Outstanding Balance
$53,130
Interest Rate
3.53%
Mortgage Type
New Conventional
Estimated Equity
$232,938
Purchase Details
Closed on
Dec 7, 2009
Sold by
Ryals Patricia M
Bought by
Saylor Gina C and Carpenter Chessie B
Home Financials for this Owner
Home Financials are based on the most recent Mortgage that was taken out on this home.
Original Mortgage
$100,000
Interest Rate
5.02%
Mortgage Type
New Conventional
Purchase Details
Closed on
Sep 21, 2001
Sold by
Bryant Thelma Inez
Bought by
Ryals Patricia M
Create a Home Valuation Report for This Property
The Home Valuation Report is an in-depth analysis detailing your home's value as well as a comparison with similar homes in the area
Purchase History
| Date | Buyer | Sale Price | Title Company |
|---|---|---|---|
| Saylor Gina C | -- | None Available | |
| Saylor Gina C | $155,000 | None Available | |
| Ryals Patricia M | $106,800 | -- |
Source: Public Records
Mortgage History
| Date | Status | Borrower | Loan Amount |
|---|---|---|---|
| Open | Saylor Gina C | $113,500 | |
| Previous Owner | Saylor Gina C | $100,000 |
Source: Public Records
Tax History
| Year | Tax Paid | Tax Assessment Tax Assessment Total Assessment is a certain percentage of the fair market value that is determined by local assessors to be the total taxable value of land and additions on the property. | Land | Improvement |
|---|---|---|---|---|
| 2025 | $2,300 | $100,604 | $13,800 | $86,804 |
| 2024 | $2,244 | $95,340 | $13,800 | $81,540 |
| 2023 | $1,396 | $79,950 | $12,000 | $67,950 |
| 2022 | $1,751 | $57,584 | $9,167 | $48,417 |
| 2021 | $1,922 | $57,584 | $9,167 | $48,417 |
| 2020 | $1,964 | $57,584 | $9,167 | $48,417 |
| 2019 | $1,980 | $57,584 | $9,167 | $48,417 |
| 2018 | $3,212 | $57,584 | $9,167 | $48,417 |
| 2017 | $1,895 | $57,584 | $9,167 | $48,417 |
| 2016 | $1,750 | $57,584 | $9,167 | $48,417 |
| 2015 | $2,473 | $57,584 | $9,167 | $48,417 |
| 2014 | $2,473 | $57,584 | $9,167 | $48,417 |
Source: Public Records
Map
Nearby Homes
- 3708 Jones Rd
- 3720 Dean Dr
- 405 Stonecrest Ct
- 6670 Fran Dr
- 813 Ocala National Trail
- 122 Hudson Way
- 123 Hudson Way
- 3491 Sandy Cir
- 308 Ellis Ct
- 106 Hudson Way
- 5608 Swymer Dr
- 4202 Cyndy Jo Cir
- 6045 Cara Dr
- 3150 Holleman Dr
- 330 Cody Dr
- 3906 Hartley Bridge Rd
- 108 Alayna Ct
- 6233 Skipperton Rd
- 104 Alayna Ct
- 102 Haylie Ct
Your Personal Tour Guide
Ask me questions while you tour the home.