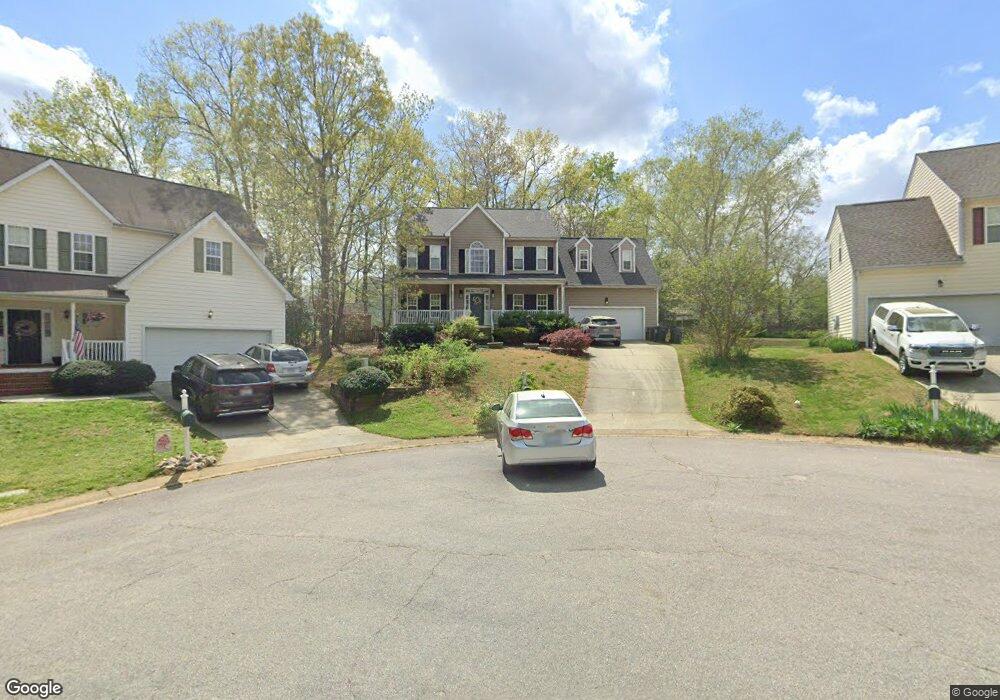
104 Knobview Ct Holly Springs, NC 27540
Estimated Value: $528,000 - $554,000
5
Beds
4
Baths
2,732
Sq Ft
$199/Sq Ft
Est. Value
About This Home
This home is located at 104 Knobview Ct, Holly Springs, NC 27540 and is currently estimated at $543,480, approximately $198 per square foot. 104 Knobview Ct is a home located in Wake County with nearby schools including Oakview Elementary School, Apex Friendship Middle School, and Holly Springs High School.
Ownership History
Date
Name
Owned For
Owner Type
Purchase Details
Closed on
Nov 18, 2021
Sold by
Alexander Frank Hay and Alexander Christine Fullerto
Bought by
Seabrook Builders Llc
Current Estimated Value
Purchase Details
Closed on
Feb 21, 2007
Sold by
Alexander Susan M
Bought by
Alexander Frank H
Purchase Details
Closed on
Jun 28, 2002
Sold by
Parker & Lancaster Corp
Bought by
Alexander Frank H and Alexander Susan M
Home Financials for this Owner
Home Financials are based on the most recent Mortgage that was taken out on this home.
Original Mortgage
$166,800
Interest Rate
6.86%
Purchase Details
Closed on
Oct 23, 2000
Sold by
Builder Resource & Development Co Ltd
Bought by
Parker & Lancaster Corp
Create a Home Valuation Report for This Property
The Home Valuation Report is an in-depth analysis detailing your home's value as well as a comparison with similar homes in the area
Home Values in the Area
Average Home Value in this Area
Purchase History
| Date | Buyer | Sale Price | Title Company |
|---|---|---|---|
| Seabrook Builders Llc | -- | None Listed On Document | |
| Alexander Frank H | -- | None Available | |
| Alexander Frank H | $208,500 | -- | |
| Parker & Lancaster Corp | $174,000 | -- |
Source: Public Records
Mortgage History
| Date | Status | Borrower | Loan Amount |
|---|---|---|---|
| Previous Owner | Alexander Frank H | $166,800 |
Source: Public Records
Tax History Compared to Growth
Tax History
| Year | Tax Paid | Tax Assessment Tax Assessment Total Assessment is a certain percentage of the fair market value that is determined by local assessors to be the total taxable value of land and additions on the property. | Land | Improvement |
|---|---|---|---|---|
| 2025 | $4,512 | $521,961 | $120,000 | $401,961 |
| 2024 | $4,493 | $521,961 | $120,000 | $401,961 |
| 2023 | $3,700 | $341,212 | $50,000 | $291,212 |
| 2022 | $3,572 | $341,212 | $50,000 | $291,212 |
| 2021 | $3,506 | $341,212 | $50,000 | $291,212 |
| 2020 | $3,506 | $341,212 | $50,000 | $291,212 |
| 2019 | $3,283 | $271,179 | $48,000 | $223,179 |
| 2018 | $2,967 | $271,179 | $48,000 | $223,179 |
| 2017 | $2,861 | $271,179 | $48,000 | $223,179 |
| 2016 | $2,821 | $271,179 | $48,000 | $223,179 |
| 2015 | $2,933 | $277,579 | $48,000 | $229,579 |
| 2014 | $2,832 | $277,579 | $48,000 | $229,579 |
Source: Public Records
Map
Nearby Homes
- 105 Townsgate Ct
- 725 Little Leaf Ct
- 713 Littleleaf Ct
- 109 Bright Shade Ct
- 717 Starkland Way
- 108 Crabwall Ct
- 749 W Holly Springs Rd
- 743 W Holly Springs Rd
- 755 W Holly Springs Rd
- 737 W Holly Springs Rd
- 761 W Holly Springs Rd
- 329 N Main St
- 321 Blalock St
- 225 Douglas St
- 124 Cliffdale Rd
- 318 Blalock St
- 112 Burt St
- 105 Cross Hill Ln
- 321 Cross Hill Ln
- 126 Tuska Hills Dr
- 100 Knobview Ct
- 108 Knobview Ct
- 109 Townsgate Ct
- 1105 Linden Ridge Dr
- 1101 Linden Ridge Dr
- 100 Echo Hills Ct
- 109 Knobview Ct
- 108 Echo Creek Place
- 101 Townsgate Ct
- 112 Townsgate Ct
- 105 Echo Hills Ct
- 101 Knobview Ct
- 105 Knobview Ct
- 109 Echo Hills Ct
- 101 Echo Hills Ct
- 108 Townsgate Ct
- 201 Echo Hills Ct
- 721 Little Leaf Ct
- 1100 Linden Ridge Dr
- 100 Spooner Ct