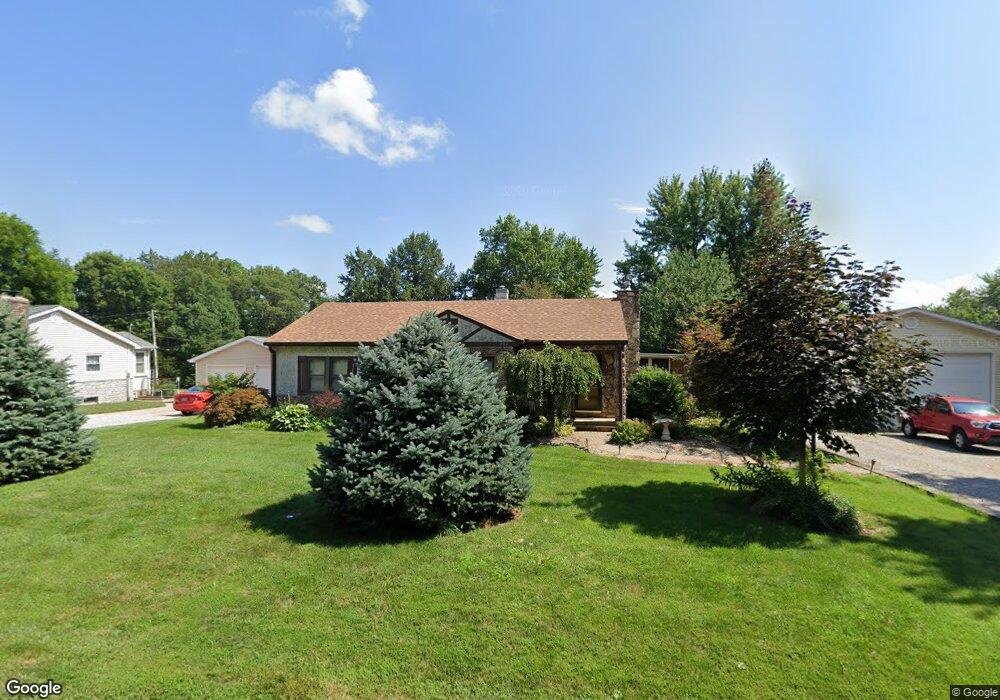
104 Linwood Dr Belleville, IL 62221
Estimated Value: $217,000 - $245,439
--
Bed
--
Bath
1,102
Sq Ft
$208/Sq Ft
Est. Value
About This Home
This home is located at 104 Linwood Dr, Belleville, IL 62221 and is currently estimated at $229,110, approximately $207 per square foot. 104 Linwood Dr is a home located in St. Clair County with nearby schools including Shiloh Elementary School, Shiloh Middle School, and O'Fallon Township High School.
Ownership History
Date
Name
Owned For
Owner Type
Purchase Details
Closed on
Jan 20, 2017
Sold by
Rozkiewicz John A and Rozkiewicz Diane R
Bought by
Sodam James J
Current Estimated Value
Home Financials for this Owner
Home Financials are based on the most recent Mortgage that was taken out on this home.
Original Mortgage
$125,600
Outstanding Balance
$103,535
Interest Rate
4.13%
Mortgage Type
New Conventional
Estimated Equity
$125,575
Purchase Details
Closed on
Aug 27, 2009
Sold by
Rozkiewicz Diane R
Bought by
Rozkiewicz John A and Rozkiewicz Dianer
Create a Home Valuation Report for This Property
The Home Valuation Report is an in-depth analysis detailing your home's value as well as a comparison with similar homes in the area
Home Values in the Area
Average Home Value in this Area
Purchase History
| Date | Buyer | Sale Price | Title Company |
|---|---|---|---|
| Sodam James J | $157,000 | Town & Country Title Co | |
| Rozkiewicz John A | -- | None Available |
Source: Public Records
Mortgage History
| Date | Status | Borrower | Loan Amount |
|---|---|---|---|
| Open | Sodam James J | $125,600 |
Source: Public Records
Tax History Compared to Growth
Tax History
| Year | Tax Paid | Tax Assessment Tax Assessment Total Assessment is a certain percentage of the fair market value that is determined by local assessors to be the total taxable value of land and additions on the property. | Land | Improvement |
|---|---|---|---|---|
| 2024 | $4,746 | $64,013 | $10,447 | $53,566 |
| 2023 | $4,178 | $55,086 | $10,139 | $44,947 |
| 2022 | $4,012 | $51,310 | $9,444 | $41,866 |
| 2021 | $3,749 | $48,251 | $8,881 | $39,370 |
| 2020 | $3,869 | $45,539 | $8,382 | $37,157 |
| 2019 | $3,258 | $39,037 | $8,707 | $30,330 |
| 2018 | $3,201 | $37,922 | $8,458 | $29,464 |
| 2017 | $2,171 | $36,142 | $8,061 | $28,081 |
| 2016 | $2,146 | $35,455 | $7,908 | $27,547 |
| 2014 | $746 | $29,588 | $5,032 | $24,556 |
| 2013 | $1,865 | $29,987 | $5,100 | $24,887 |
Source: Public Records
Map
Nearby Homes
- 101 Montrose Ct
- 3567 Sky Hawk Dr
- 3533 Capri Ln
- 409 Sage Dr
- 3536 Harbor Way
- 3716 Osprey Ct
- 3830 Breezy Hill
- 3700 Osprey Ct
- xxxx Christine Dr
- 414 Grand Reserve
- 433 Briarberry Dr
- 3719 Thicket Dr
- 3714 Thicket Dr
- 31 Ramona Dr
- 3745 Thicket Dr
- 505 Master Ct
- xxxx Chippewa Dr
- 3740 Golfview Cir
- Brady Plan at Indian Springs - Indian Spring
- Winchester B Plan at Indian Springs - Indian Spring