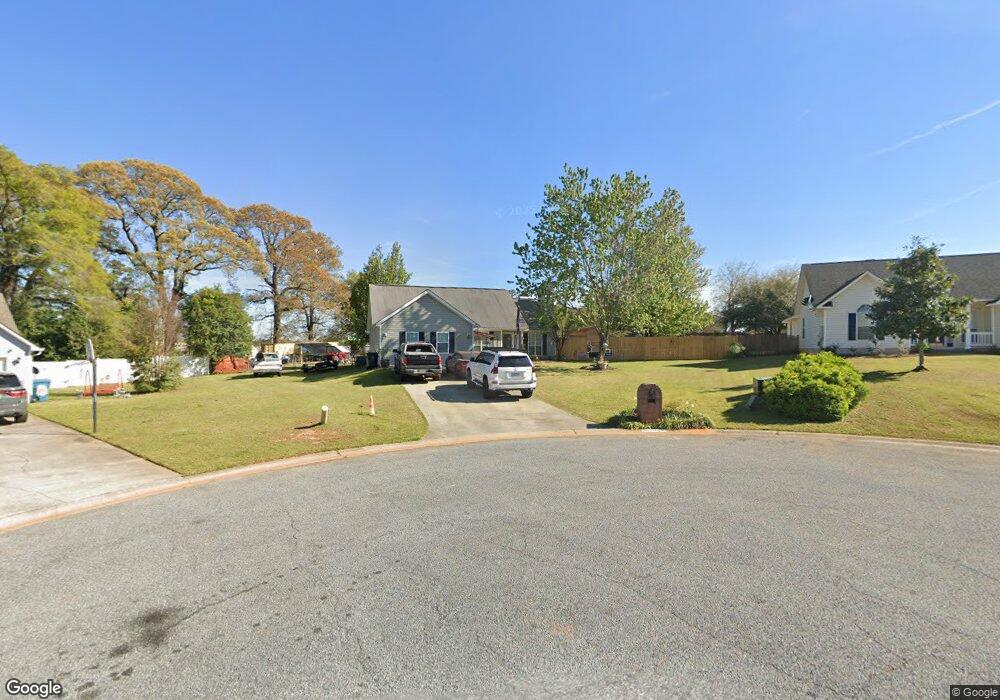
104 Meadow Ct Warner Robins, GA 31088
Estimated Value: $200,039 - $316,000
Studio
2
Baths
1,301
Sq Ft
$182/Sq Ft
Est. Value
About This Home
This home is located at 104 Meadow Ct, Warner Robins, GA 31088 and is currently estimated at $236,510, approximately $181 per square foot. 104 Meadow Ct is a home located in Houston County with nearby schools including Lake Joy Primary School, Lake Joy Elementary School, and Feagin Mill Middle School.
Ownership History
Date
Name
Owned For
Owner Type
Purchase Details
Closed on
Mar 24, 2014
Sold by
Orman Kerry A
Bought by
Nelson Kerry A
Current Estimated Value
Home Financials for this Owner
Home Financials are based on the most recent Mortgage that was taken out on this home.
Original Mortgage
$74,733
Outstanding Balance
$19,575
Interest Rate
4.36%
Mortgage Type
New Conventional
Estimated Equity
$216,935
Purchase Details
Closed on
Dec 15, 2000
Sold by
Orman Michael C and Kerry A*
Bought by
Orman Kerry A
Purchase Details
Closed on
Jul 28, 1997
Sold by
Meredith William J
Bought by
Orman Michael C and Kerry A*
Purchase Details
Closed on
May 31, 1995
Sold by
Williams Kelly J
Bought by
Meredith William J
Purchase Details
Closed on
Nov 4, 1994
Sold by
Mlc Inc
Bought by
Williams Kelly J
Purchase Details
Closed on
Jun 9, 1994
Sold by
Cooper-Sugrue Properties Inc
Bought by
Mlc Inc
Purchase Details
Closed on
Jan 7, 1994
Bought by
Cooper-Sugrue Properties Inc
Create a Home Valuation Report for This Property
The Home Valuation Report is an in-depth analysis detailing your home's value as well as a comparison with similar homes in the area
Home Values in the Area
Average Home Value in this Area
Purchase History
| Date | Buyer | Sale Price | Title Company |
|---|---|---|---|
| Nelson Kerry A | -- | -- | |
| Orman Kerry A | -- | -- | |
| Orman Michael C | $84,500 | -- | |
| Meredith William J | $79,900 | -- | |
| Williams Kelly J | $12,000 | -- | |
| Mlc Inc | -- | -- | |
| Cooper-Sugrue Properties Inc | -- | -- |
Source: Public Records
Mortgage History
| Date | Status | Borrower | Loan Amount |
|---|---|---|---|
| Open | Nelson Kerry A | $74,733 |
Source: Public Records
Tax History
| Year | Tax Paid | Tax Assessment Tax Assessment Total Assessment is a certain percentage of the fair market value that is determined by local assessors to be the total taxable value of land and additions on the property. | Land | Improvement |
|---|---|---|---|---|
| 2025 | $1,374 | $62,880 | $10,800 | $52,080 |
| 2024 | $1,311 | $54,800 | $9,600 | $45,200 |
| 2023 | $1,206 | $49,880 | $9,000 | $40,880 |
| 2022 | $1,013 | $41,920 | $9,000 | $32,920 |
| 2021 | $935 | $38,480 | $9,000 | $29,480 |
| 2020 | $893 | $36,600 | $5,600 | $31,000 |
| 2019 | $893 | $36,600 | $5,600 | $31,000 |
| 2018 | $910 | $37,280 | $5,600 | $31,680 |
| 2017 | $911 | $37,280 | $5,600 | $31,680 |
| 2016 | $912 | $37,280 | $5,600 | $31,680 |
| 2015 | $914 | $37,280 | $5,600 | $31,680 |
| 2014 | -- | $37,280 | $5,600 | $31,680 |
| 2013 | -- | $37,280 | $5,600 | $31,680 |
Source: Public Records
Map
Nearby Homes
- 102 Meadow Ct
- 1025 Feagin Mill Rd
- 0 Feagin Mill Rd Unit 10572748
- 0 Feagin Mill Rd Unit 254957
- 0 Feagin Mill Rd Unit 180689
- 113 Jana Ct
- 104 Sandy Run Dr
- 230 Tucker Rd
- 502 Bella Notte Cir
- 502 Bella Notte Cir Unit 15A
- 500 Bella Notte Cir Unit 16A
- 500 Bella Notte Cir
- 409 Bella Notte Cir Unit 1D
- 409 Bella Notte Cir
- 103 Sandy Valley Dr
- 203 Lattice Bend
- 416 Bella Notte Cir
- 316 Haverhill Cir
- 414 Bella Notte Cir
- 414 Bella Notte Cir Unit 23A
- 106 Meadow Ct
- 1007 Feagin Mill Rd
- 1005 Feagin Mill Rd
- 1009 Feagin Mill Rd
- 100 Meadow Ct
- 107 Meadow Ct
- 100 Meadow View Dr
- 105 Meadow Ct
- 105 Meadow Ct
- 104 Meadow View Dr
- 105 Meadow View Dr
- 1004 Feagin Mill Rd
- 101 Meadow View Dr
- 0 S Houston Lake Rd
- 0 S Houston Lake Rd Unit 151403
- 0 S Houston Lake Rd Unit 157349
- 0 S Houston Lake Rd Unit 157348
- 0 S Houston Lake Rd Unit 225939
- 0 S Houston Lake Rd Unit 7104180
- 0 S Houston Lake Rd Unit 20068371
Your Personal Tour Guide
Ask me questions while you tour the home.