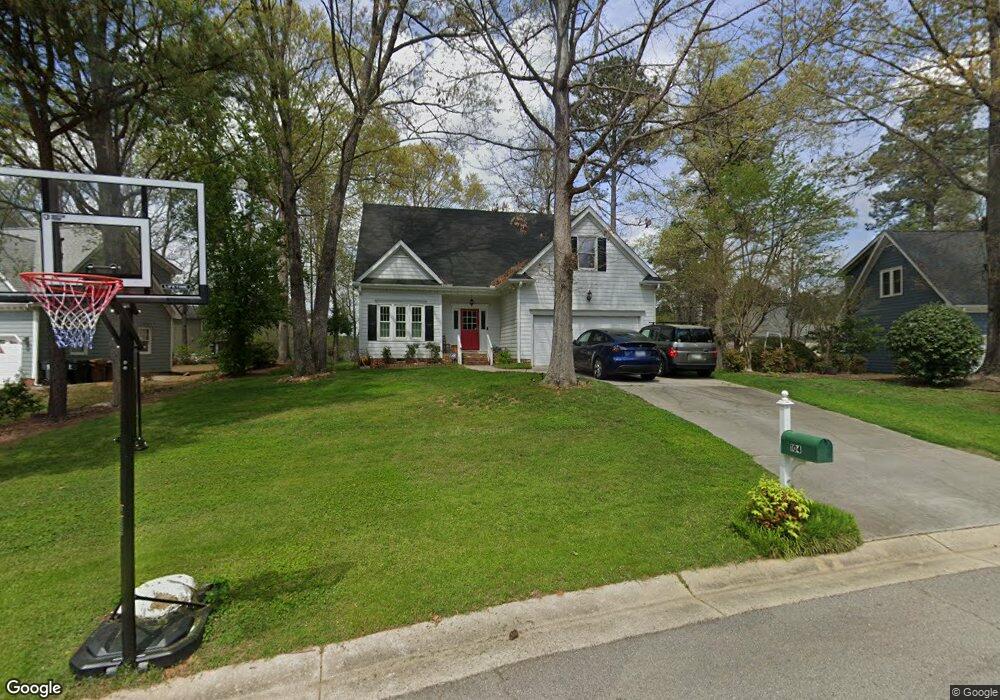
104 Merrimont Way Holly Springs, NC 27540
Estimated Value: $433,000 - $499,000
3
Beds
3
Baths
2,035
Sq Ft
$233/Sq Ft
Est. Value
About This Home
This home is located at 104 Merrimont Way, Holly Springs, NC 27540 and is currently estimated at $473,838, approximately $232 per square foot. 104 Merrimont Way is a home located in Wake County with nearby schools including Oakview Elementary School, Apex Friendship Middle School, and Holly Springs High School.
Ownership History
Date
Name
Owned For
Owner Type
Purchase Details
Closed on
Apr 9, 2019
Sold by
Opendoor Property W16 Llc
Bought by
Brady Derek S
Current Estimated Value
Home Financials for this Owner
Home Financials are based on the most recent Mortgage that was taken out on this home.
Original Mortgage
$240,336
Outstanding Balance
$211,298
Interest Rate
4.3%
Mortgage Type
New Conventional
Estimated Equity
$262,540
Purchase Details
Closed on
Mar 4, 2019
Sold by
Gray Robert P and Gray Rhonda R
Bought by
Opendoor Property W16 Llc
Home Financials for this Owner
Home Financials are based on the most recent Mortgage that was taken out on this home.
Original Mortgage
$240,336
Outstanding Balance
$211,298
Interest Rate
4.3%
Mortgage Type
New Conventional
Estimated Equity
$262,540
Purchase Details
Closed on
Oct 22, 2014
Sold by
Airington Andrea Maxine
Bought by
Gray Robert and Gray Rhonda
Home Financials for this Owner
Home Financials are based on the most recent Mortgage that was taken out on this home.
Original Mortgage
$218,500
Interest Rate
4.29%
Mortgage Type
New Conventional
Purchase Details
Closed on
Nov 19, 2009
Sold by
Hudyma Edward and Hudyma Joann
Bought by
Hudyma Edward
Create a Home Valuation Report for This Property
The Home Valuation Report is an in-depth analysis detailing your home's value as well as a comparison with similar homes in the area
Home Values in the Area
Average Home Value in this Area
Purchase History
| Date | Buyer | Sale Price | Title Company |
|---|---|---|---|
| Brady Derek S | $300,500 | None Available | |
| Opendoor Property W16 Llc | $287,000 | None Available | |
| Gray Robert | $230,000 | None Available | |
| Hudyma Edward | -- | None Available |
Source: Public Records
Mortgage History
| Date | Status | Borrower | Loan Amount |
|---|---|---|---|
| Open | Brady Derek S | $240,336 | |
| Previous Owner | Gray Robert | $218,500 |
Source: Public Records
Tax History Compared to Growth
Tax History
| Year | Tax Paid | Tax Assessment Tax Assessment Total Assessment is a certain percentage of the fair market value that is determined by local assessors to be the total taxable value of land and additions on the property. | Land | Improvement |
|---|---|---|---|---|
| 2025 | $3,585 | $414,252 | $120,000 | $294,252 |
| 2024 | $3,570 | $414,252 | $120,000 | $294,252 |
| 2023 | $3,035 | $279,520 | $50,000 | $229,520 |
| 2022 | $2,930 | $279,520 | $50,000 | $229,520 |
| 2021 | $2,876 | $279,520 | $50,000 | $229,520 |
| 2020 | $2,876 | $279,520 | $50,000 | $229,520 |
| 2019 | $2,693 | $222,172 | $48,000 | $174,172 |
| 2018 | $2,435 | $222,172 | $48,000 | $174,172 |
| 2017 | $2,347 | $222,172 | $48,000 | $174,172 |
| 2016 | $2,315 | $222,172 | $48,000 | $174,172 |
| 2015 | $2,432 | $229,795 | $48,000 | $181,795 |
| 2014 | -- | $229,795 | $48,000 | $181,795 |
Source: Public Records
Map
Nearby Homes
- 329 N Main St
- 725 Little Leaf Ct
- 109 Bright Shade Ct
- 713 Littleleaf Ct
- 105 Townsgate Ct
- 717 Starkland Way
- 112 Sanchez Ct
- 108 Crabwall Ct
- 138 Cobalt Creek Way
- 321 Blalock St
- 318 Blalock St
- 737 W Holly Springs Rd
- 225 Douglas St
- 743 W Holly Springs Rd
- 749 W Holly Springs Rd
- 124 Cliffdale Rd
- 755 W Holly Springs Rd
- 761 W Holly Springs Rd
- 112 Burt St
- 208 Apple Drupe Way
- 100 Merrimont Way
- 805 Bonhurst Dr
- 108 Merrimont Way
- 801 Bonhurst Dr
- 105 White Cedar Run
- 709 Laurel Bay Ln
- 101 White Cedar Run
- 112 Merrimont Way
- 109 White Cedar Run
- 105 Merrimont Way
- 705 Laurel Bay Ln
- 0 White Cedar Run
- 800 Laurel Bay Ln
- 717 Bonhurst Dr
- 704 Laurel Bay Ln
- 800 Bonhurst Dr
- 109 Merrimont Way
- 204 Spruce Ridge Ct
- 208 Spruce Ridge Ct
- 701 Laurel Bay Ln