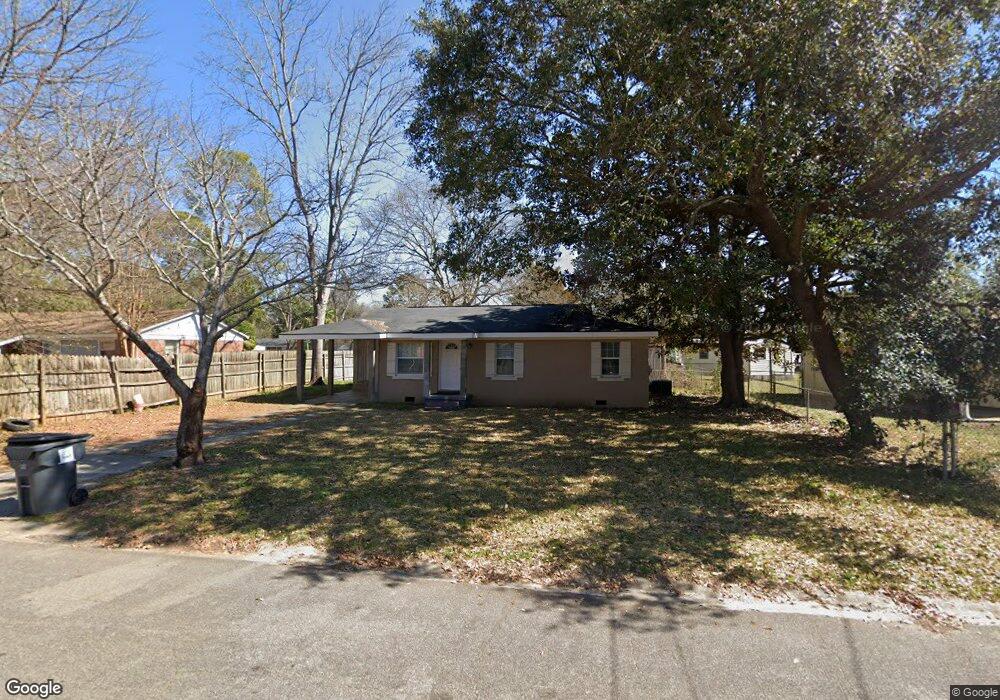
104 Mockingbird Ln Warner Robins, GA 31093
Estimated Value: $86,747 - $118,000
3
Beds
1
Bath
875
Sq Ft
$116/Sq Ft
Est. Value
About This Home
This home is located at 104 Mockingbird Ln, Warner Robins, GA 31093 and is currently estimated at $101,582, approximately $116 per square foot. 104 Mockingbird Ln is a home located in Houston County with nearby schools including Parkwood Elementary School, Northside Middle School, and Northside High School.
Ownership History
Date
Name
Owned For
Owner Type
Purchase Details
Closed on
Sep 23, 2010
Sold by
Rooker Billie H
Bought by
Alcanter Noe
Current Estimated Value
Purchase Details
Closed on
May 11, 1998
Sold by
Rooker John R Estate
Bought by
Rooker Billie H
Purchase Details
Closed on
Jul 19, 1996
Sold by
Fleet Finance Inc
Bought by
Rooker John R and Billie H*
Purchase Details
Closed on
Apr 2, 1996
Sold by
Thompson Deloris M
Bought by
Fleet Finance Inc
Purchase Details
Closed on
Apr 13, 1990
Sold by
Paramount Builders Inc
Bought by
Thompson Deloris M
Purchase Details
Closed on
Jan 9, 1989
Sold by
Brown Edward B
Bought by
Paramount Builders Inc
Purchase Details
Closed on
Jul 7, 1986
Sold by
Stewart Jackie M
Bought by
Brown Edward B
Purchase Details
Closed on
Jul 18, 1966
Sold by
Norton Charles D and Norton Wife
Bought by
Stewart Jackie M
Purchase Details
Closed on
Sep 28, 1960
Bought by
Norton Charles D and Norton Wife
Create a Home Valuation Report for This Property
The Home Valuation Report is an in-depth analysis detailing your home's value as well as a comparison with similar homes in the area
Home Values in the Area
Average Home Value in this Area
Purchase History
| Date | Buyer | Sale Price | Title Company |
|---|---|---|---|
| Alcanter Noe | $12,000 | None Available | |
| Rooker Billie H | -- | -- | |
| Rooker John R | $28,000 | -- | |
| Fleet Finance Inc | $25,800 | -- | |
| Thompson Deloris M | -- | -- | |
| Paramount Builders Inc | -- | -- | |
| Brown Edward B | -- | -- | |
| Stewart Jackie M | -- | -- | |
| Norton Charles D | -- | -- |
Source: Public Records
Tax History
| Year | Tax Paid | Tax Assessment Tax Assessment Total Assessment is a certain percentage of the fair market value that is determined by local assessors to be the total taxable value of land and additions on the property. | Land | Improvement |
|---|---|---|---|---|
| 2025 | $465 | $15,960 | $6,000 | $9,960 |
| 2024 | $466 | $14,240 | $4,800 | $9,440 |
| 2023 | $368 | $11,160 | $3,080 | $8,080 |
| 2022 | $174 | $7,560 | $3,080 | $4,480 |
| 2021 | $142 | $6,160 | $3,080 | $3,080 |
| 2020 | $164 | $7,040 | $3,080 | $3,960 |
| 2019 | $164 | $7,040 | $3,080 | $3,960 |
| 2018 | $164 | $7,040 | $3,080 | $3,960 |
| 2017 | $164 | $7,040 | $3,080 | $3,960 |
| 2016 | $164 | $7,040 | $3,080 | $3,960 |
| 2015 | -- | $7,040 | $3,080 | $3,960 |
| 2014 | -- | $7,760 | $3,080 | $4,680 |
| 2013 | -- | $7,760 | $3,080 | $4,680 |
Source: Public Records
Map
Nearby Homes
- 313 Orchard Ln
- 94 Ravenwood Way
- 402 & 404 Green St
- 116 Woodlawn Ave
- 135 Briardale Ave
- 135 Briardale Ave Unit Ave
- 119 Woodlawn Ave
- 118 Briardale Ave
- 112 Briardale Ave
- 110 Briardale Ave
- 500 Northside Dr
- 118 Meadowcliff Cir
- 306 Woodlawn Ave
- 125 Anne Dr
- 0 N Houston Rd Unit Northlake Dr.
- 114 Williams Terrace
- 125 Northsky Dr
- 145 Northsky Dr
- 113 Pearce Dr
- 111 Wisconsin Ave
- 106 Mockingbird Ln
- 102 Mockingbird Ln
- 309 Briardale Ave
- 307 Briardale Ave
- 311 Briardale Ave
- 108 Mockingbird Ln
- 109 Mockingbird Ln
- 111 Mockingbird Ln
- 110 Mockingbird Ln
- 113 Mockingbird Ln
- 105 Mockingbird Ln
- 305 Briardale Ave
- 115 Mockingbird Ln
- 103 Mockingbird Ln
- 308 Briardale Ave
- 112 Mockingbird Ln
- 315 Briardale Ave
- 317 Orchard Ln
- 306 Briardale Ave
- 310 Briardale Ave
Your Personal Tour Guide
Ask me questions while you tour the home.