Estimated Value: $109,000 - $124,000
4
Beds
2
Baths
2,520
Sq Ft
$45/Sq Ft
Est. Value
About This Home
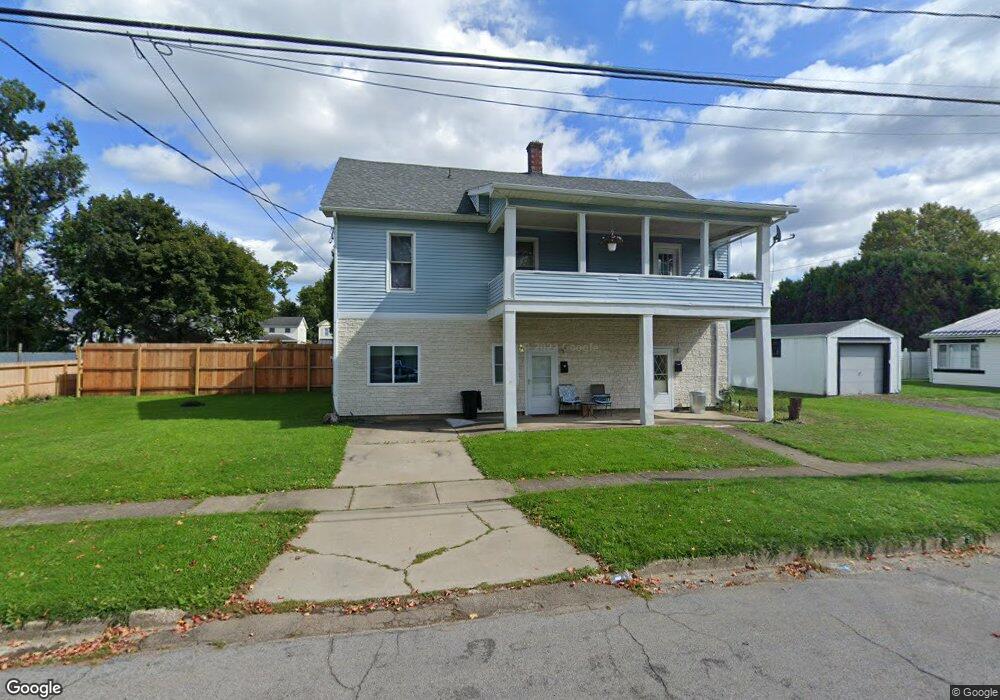
This home is located at 104 N 19th St, Olean, NY 14760 and is currently estimated at $114,096, approximately $45 per square foot. 104 N 19th St is a home located in Cattaraugus County with nearby schools including Olean Intermediate-Middle School, Olean Senior High School, and Southern Tier Catholic School.
Ownership History
Date
Name
Owned For
Owner Type
Purchase Details
Closed on
May 20, 2022
Sold by
Maynard Martin G
Bought by
Akwy Llc
Current Estimated Value
Home Financials for this Owner
Home Financials are based on the most recent Mortgage that was taken out on this home.
Original Mortgage
$69,600
Outstanding Balance
$65,275
Interest Rate
4.72%
Mortgage Type
Purchase Money Mortgage
Estimated Equity
$48,821
Purchase Details
Closed on
Jul 15, 2013
Sold by
Maynard Martin
Bought by
Maynard Martin
Purchase Details
Closed on
Mar 15, 2006
Sold by
Padlo Raymond
Bought by
Maynard Martin
Create a Home Valuation Report for This Property
The Home Valuation Report is an in-depth analysis detailing your home's value as well as a comparison with similar homes in the area
Home Values in the Area
Average Home Value in this Area
Purchase History
| Date | Buyer | Sale Price | Title Company |
|---|---|---|---|
| Akwy Llc | $87,000 | None Available | |
| Maynard Martin | -- | Terry Raszeja | |
| Maynard Martin | $65,000 | Daniel R. Palumbo |
Source: Public Records
Mortgage History
| Date | Status | Borrower | Loan Amount |
|---|---|---|---|
| Open | Akwy Llc | $69,600 |
Source: Public Records
Tax History
| Year | Tax Paid | Tax Assessment Tax Assessment Total Assessment is a certain percentage of the fair market value that is determined by local assessors to be the total taxable value of land and additions on the property. | Land | Improvement |
|---|---|---|---|---|
| 2025 | $4,205 | $66,500 | $2,200 | $64,300 |
| 2024 | $4,205 | $66,500 | $2,200 | $64,300 |
| 2023 | $1,843 | $66,000 | $2,200 | $63,800 |
| 2022 | $2,521 | $66,000 | $2,200 | $63,800 |
| 2021 | $2,594 | $66,000 | $2,200 | $63,800 |
| 2020 | $5,836 | $66,000 | $2,200 | $63,800 |
| 2019 | $1,183 | $66,000 | $2,200 | $63,800 |
| 2018 | $6,584 | $66,000 | $2,200 | $63,800 |
| 2017 | $5,651 | $66,000 | $2,200 | $63,800 |
| 2016 | $5,597 | $66,000 | $2,200 | $63,800 |
| 2015 | -- | $66,000 | $2,200 | $63,800 |
| 2014 | -- | $66,000 | $2,200 | $63,800 |
Source: Public Records
Map
Nearby Homes
- 108 S 18th St
- 111 S 18th St
- 113 S 18th St
- 114 S 17th St
- 1705 W State St
- 121 S 17th St
- 224 S 16th St
- 132 N 15th St
- 204 N 24th St
- 216 N 14th St
- 135 N 12th St
- 207 N 11th St
- 129 S 11th St
- 1205 W Sullivan St
- 1102 Anderson Ave
- 1013 W Sullivan St
- 3019 Nys Route 417
- 3031 Nys Route 417
- 118 S 7th St
- 3033 W State St
Your Personal Tour Guide
Ask me questions while you tour the home.