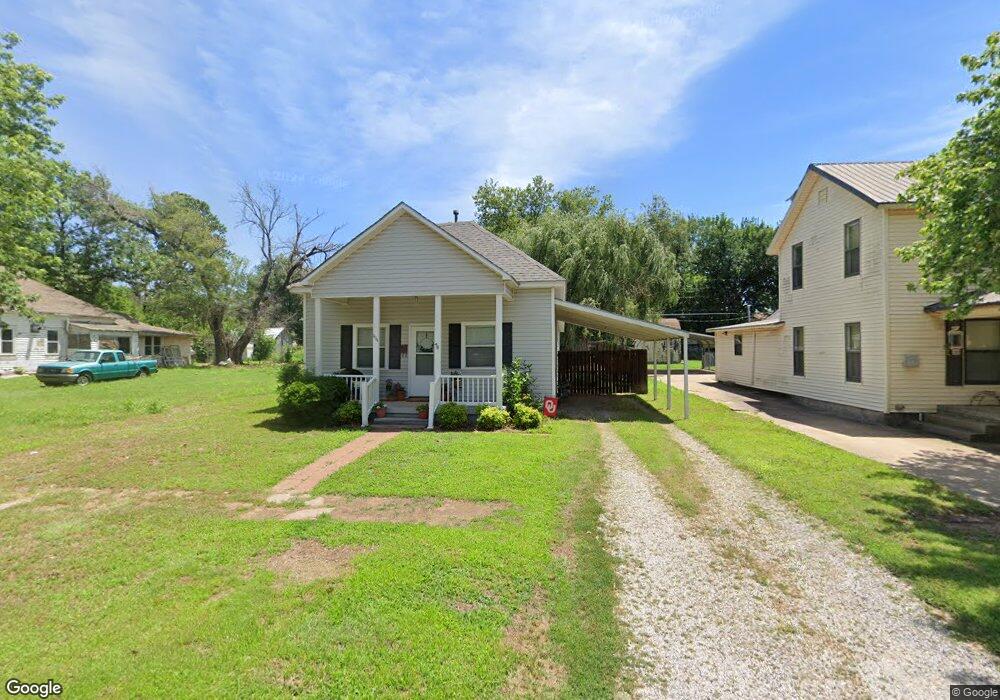
104 N 2nd St Unit 3000 Tonkawa, OK 74653
Estimated Value: $59,000 - $64,477
2
Beds
1
Bath
864
Sq Ft
$72/Sq Ft
Est. Value
About This Home
This home is located at 104 N 2nd St Unit 3000, Tonkawa, OK 74653 and is currently estimated at $61,869, approximately $71 per square foot. 104 N 2nd St Unit 3000 is a home located in Kay County with nearby schools including Tonkawa Elementary School, Tonkawa Middle School, and Tonkawa High School.
Ownership History
Date
Name
Owned For
Owner Type
Purchase Details
Closed on
Aug 16, 2005
Sold by
Smith Ekuzabeth Drew and Smith Brad
Bought by
Hobson Robin
Current Estimated Value
Home Financials for this Owner
Home Financials are based on the most recent Mortgage that was taken out on this home.
Original Mortgage
$36,550
Outstanding Balance
$19,188
Interest Rate
5.65%
Mortgage Type
New Conventional
Estimated Equity
$42,681
Purchase Details
Closed on
Mar 26, 2004
Sold by
Mtg Electronic Reg System
Bought by
Elizabeth Williams
Purchase Details
Closed on
Oct 20, 2003
Sold by
Timothy Focke - Sheriff
Bought by
Mortg Elec Reg Sys Inc
Purchase Details
Closed on
Sep 12, 2002
Sold by
Service Bank
Bought by
Timothy Focke
Purchase Details
Closed on
Jan 7, 2002
Sold by
Betty Stanley and Betty Kesinger
Bought by
Service Bank
Purchase Details
Closed on
Mar 2, 1998
Sold by
Mc John and Mc Murtrie C
Bought by
Betty Stanley and Betty Kesinger
Purchase Details
Closed on
Jun 3, 1991
Create a Home Valuation Report for This Property
The Home Valuation Report is an in-depth analysis detailing your home's value as well as a comparison with similar homes in the area
Home Values in the Area
Average Home Value in this Area
Purchase History
| Date | Buyer | Sale Price | Title Company |
|---|---|---|---|
| Hobson Robin | $35,500 | -- | |
| Elizabeth Williams | $19,000 | -- | |
| Mortg Elec Reg Sys Inc | -- | -- | |
| Timothy Focke | $5,000 | -- | |
| Service Bank | -- | -- | |
| Betty Stanley | $12,000 | -- | |
| -- | $12,000 | -- |
Source: Public Records
Mortgage History
| Date | Status | Borrower | Loan Amount |
|---|---|---|---|
| Open | Hobson Robin | $36,550 |
Source: Public Records
Tax History Compared to Growth
Tax History
| Year | Tax Paid | Tax Assessment Tax Assessment Total Assessment is a certain percentage of the fair market value that is determined by local assessors to be the total taxable value of land and additions on the property. | Land | Improvement |
|---|---|---|---|---|
| 2024 | $222 | $3,270 | $302 | $2,968 |
| 2023 | $222 | $3,175 | $302 | $2,873 |
| 2022 | $202 | $3,083 | $302 | $2,781 |
| 2021 | $203 | $3,083 | $302 | $2,781 |
| 2020 | $199 | $3,076 | $302 | $2,774 |
| 2019 | $182 | $2,986 | $302 | $2,684 |
| 2018 | $180 | $2,992 | $302 | $2,690 |
| 2017 | $195 | $3,061 | $302 | $2,759 |
| 2016 | $196 | $3,137 | $302 | $2,835 |
| 2015 | $198 | $3,165 | $302 | $2,863 |
| 2014 | $211 | $3,155 | $302 | $2,853 |
Source: Public Records
Map
Nearby Homes
- 501 E Grand Ave
- 103 S 4th St
- 302 N Barnes St
- 1004 E North Ave
- 207 S Barnes St
- 316 N Jenkins St
- 305 S 4th St
- 1208 E Allen Ave
- 415 S 4th St
- 1409 E North Ave
- 206 W Grand Ave
- 109 S 10th St
- 810 N Main St
- 1005 N 5th St
- 1009 N 6th St
- 1102 N 5th St
- 1110 N 6th St
- 1008 N 10th St
- 1110 N Main St
- 112 Wheatheart Dr
- 102 N 2nd St
- 106 N 2nd St
- 100 N 2nd St
- 108 N 2nd St Unit 3000
- 109 N 1st St
- 105 N 2nd St
- 101 N 2nd St
- 107 N 2nd St
- 700 E Grand Ave
- 704 E Grand Ave
- 706 E Tonkawa Ave
- 201 N 1st St Unit 3000
- 608 E Grand Ave
- 203 N 1st St
- 201 N 2nd St Unit 3000
- 606 E Grand Ave
- 206 N 2nd St
- 106 N 1st St
- 102 N 3rd St
- 106 N 3rd St