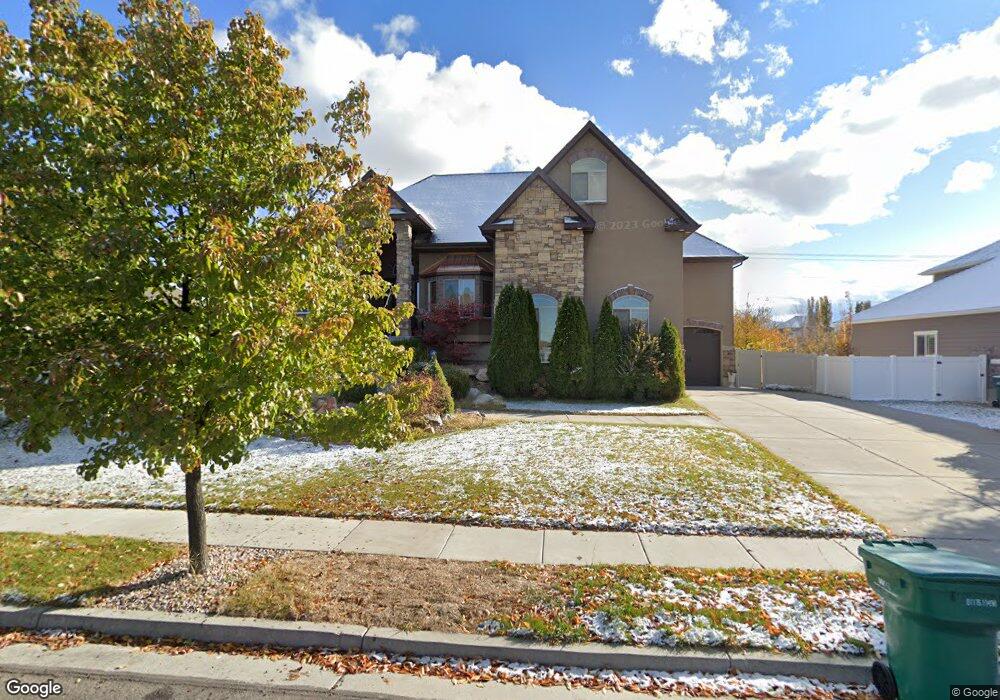
104 N 3225 W Unit 108 Layton, UT 84041
Estimated Value: $750,000 - $944,000
--
Bed
5
Baths
2,971
Sq Ft
$284/Sq Ft
Est. Value
About This Home
This home is located at 104 N 3225 W Unit 108, Layton, UT 84041 and is currently estimated at $844,211, approximately $284 per square foot. 104 N 3225 W Unit 108 is a home located in Davis County with nearby schools including Sand Springs Elementary School, Legacy Junior High School, and Layton High School.
Ownership History
Date
Name
Owned For
Owner Type
Purchase Details
Closed on
May 2, 2011
Sold by
Benchmark Real Estate Company
Bought by
Vasudevarao Prakash and Prakash Sujatha Vasudevarao
Current Estimated Value
Home Financials for this Owner
Home Financials are based on the most recent Mortgage that was taken out on this home.
Original Mortgage
$338,407
Outstanding Balance
$128,626
Interest Rate
4.77%
Mortgage Type
New Conventional
Estimated Equity
$715,585
Purchase Details
Closed on
Mar 12, 2009
Sold by
Jmr Land & Development Llc
Bought by
Knecht Steven B and Knecht Debbie
Home Financials for this Owner
Home Financials are based on the most recent Mortgage that was taken out on this home.
Original Mortgage
$59,920
Interest Rate
5.03%
Mortgage Type
Balloon
Create a Home Valuation Report for This Property
The Home Valuation Report is an in-depth analysis detailing your home's value as well as a comparison with similar homes in the area
Home Values in the Area
Average Home Value in this Area
Purchase History
| Date | Buyer | Sale Price | Title Company |
|---|---|---|---|
| Vasudevarao Prakash | -- | Founders Title Co L | |
| Knecht Steven B | -- | Bonneville Superior Title Co |
Source: Public Records
Mortgage History
| Date | Status | Borrower | Loan Amount |
|---|---|---|---|
| Open | Vasudevarao Prakash | $338,407 | |
| Previous Owner | Knecht Steven B | $59,920 |
Source: Public Records
Tax History Compared to Growth
Tax History
| Year | Tax Paid | Tax Assessment Tax Assessment Total Assessment is a certain percentage of the fair market value that is determined by local assessors to be the total taxable value of land and additions on the property. | Land | Improvement |
|---|---|---|---|---|
| 2025 | $4,412 | $463,100 | $132,834 | $330,266 |
| 2024 | $3,995 | $422,401 | $142,049 | $280,352 |
| 2023 | $3,901 | $727,000 | $150,518 | $576,482 |
| 2022 | $4,141 | $419,100 | $87,430 | $331,670 |
| 2021 | $3,763 | $568,000 | $131,124 | $436,876 |
| 2020 | $3,625 | $525,000 | $112,083 | $412,917 |
| 2019 | $3,546 | $503,000 | $110,685 | $392,315 |
| 2018 | $3,245 | $462,000 | $97,551 | $364,449 |
| 2016 | $3,077 | $226,050 | $40,548 | $185,502 |
| 2015 | $2,820 | $196,625 | $40,548 | $156,077 |
| 2014 | $2,565 | $182,852 | $40,548 | $142,304 |
| 2013 | -- | $209,000 | $40,713 | $168,287 |
Source: Public Records
Map
Nearby Homes
- 245 S Summer Breeze Ln
- 101 S 3600 W
- 454 N 3550 W
- 3535 W Overlook Dr
- 3583 W 200 S
- 2794 W Gentile St
- 567 W 3575 S
- 697 N 3275 W
- 3169 S 550 W
- 3263 W 850 N
- 2875 N Hill Rd Unit 199
- 2875 N Hill Rd Unit 27
- 306 S Sunburst Dr
- 2674 S 75 E
- 818 N 2625 W
- 2681 S 200 E
- 967 W Yamada Ct
- 3391 W 1125 N
- 162 E 2600 S
- 2601 S 200 E
- 104 N 3225 W
- 84 N 3225 W
- 84 N 3225 W Unit 107
- 124 N 3225 W
- 124 N 3225 W Unit 109
- 109 N 3225 W Unit 123
- 109 N 3225 W
- 87 N 3225 W
- 64 N 3225 W
- 127 N 3225 W
- 127 N 3225 W Unit 122
- 142 N 3225 W
- 71 N 3225 W Unit 125
- 71 N 3225 W
- 60 N 3200 W
- 46 N 3225 W Unit 105
- 143 N 3225 W Unit 121
- 143 N 3225 W
- 92 N 3300 W
- 92 N 3300 W Unit 129