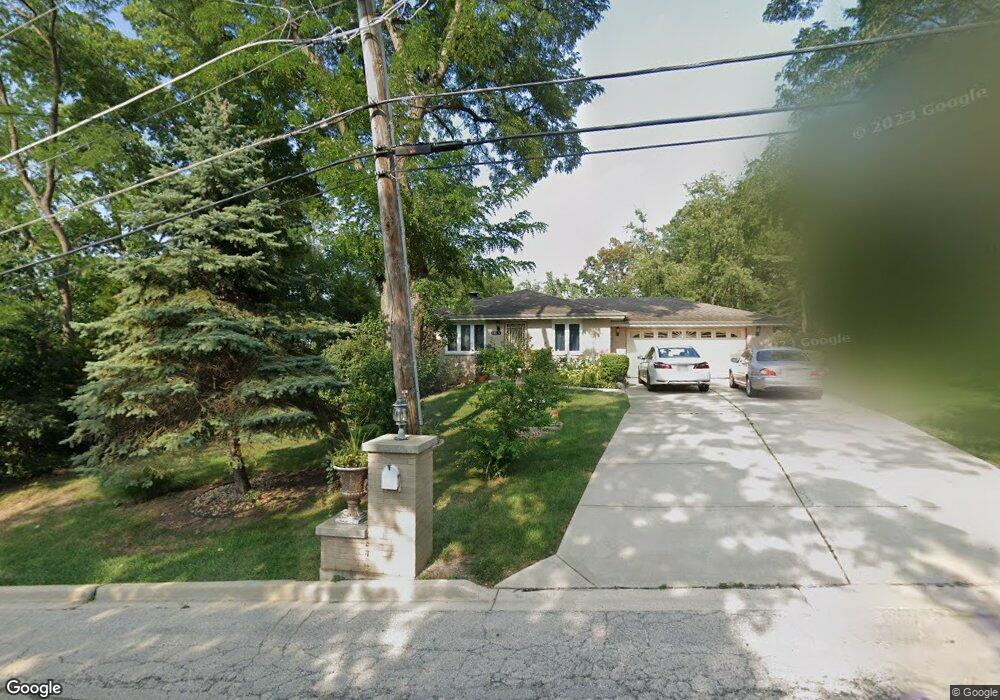
104 N Charleton St Willow Springs, IL 60480
Estimated Value: $297,000 - $374,000
3
Beds
2
Baths
1,270
Sq Ft
$275/Sq Ft
Est. Value
About This Home
This home is located at 104 N Charleton St, Willow Springs, IL 60480 and is currently estimated at $349,335, approximately $275 per square foot. 104 N Charleton St is a home located in Cook County with nearby schools including Willow Springs Elementary School, Argo Community High School, and Trinity Lutheran School.
Ownership History
Date
Name
Owned For
Owner Type
Purchase Details
Closed on
Jun 21, 2022
Sold by
Baughman Jack E
Bought by
Baughman Jordan E
Current Estimated Value
Purchase Details
Closed on
Sep 25, 2013
Sold by
Baughman Jordan E and Cervenka Laura M
Bought by
Baughman Jordan E and Baughman Jack E
Home Financials for this Owner
Home Financials are based on the most recent Mortgage that was taken out on this home.
Original Mortgage
$135,000
Interest Rate
4.5%
Mortgage Type
New Conventional
Purchase Details
Closed on
Dec 5, 2011
Sold by
Kasik Darlene C
Bought by
Baughman Jordan E and Cervanka Laura M
Home Financials for this Owner
Home Financials are based on the most recent Mortgage that was taken out on this home.
Original Mortgage
$135,744
Interest Rate
4.37%
Mortgage Type
FHA
Create a Home Valuation Report for This Property
The Home Valuation Report is an in-depth analysis detailing your home's value as well as a comparison with similar homes in the area
Home Values in the Area
Average Home Value in this Area
Purchase History
| Date | Buyer | Sale Price | Title Company |
|---|---|---|---|
| Baughman Jordan E | -- | None Listed On Document | |
| Baughman Jordan E | -- | None Available | |
| Baughman Jordan E | $168,000 | None Available |
Source: Public Records
Mortgage History
| Date | Status | Borrower | Loan Amount |
|---|---|---|---|
| Previous Owner | Baughman Jordan E | $135,000 | |
| Previous Owner | Baughman Jordan E | $135,744 |
Source: Public Records
Tax History Compared to Growth
Tax History
| Year | Tax Paid | Tax Assessment Tax Assessment Total Assessment is a certain percentage of the fair market value that is determined by local assessors to be the total taxable value of land and additions on the property. | Land | Improvement |
|---|---|---|---|---|
| 2024 | $7,055 | $26,291 | $4,313 | $21,978 |
| 2023 | $5,624 | $26,291 | $4,313 | $21,978 |
| 2022 | $5,624 | $17,305 | $3,750 | $13,555 |
| 2021 | $5,579 | $17,305 | $3,750 | $13,555 |
| 2020 | $6,217 | $19,129 | $3,750 | $15,379 |
| 2019 | $6,289 | $18,918 | $3,375 | $15,543 |
| 2018 | $6,685 | $20,434 | $3,375 | $17,059 |
| 2017 | $6,690 | $20,434 | $3,375 | $17,059 |
| 2016 | $6,084 | $16,581 | $3,000 | $13,581 |
| 2015 | $5,981 | $17,409 | $3,000 | $14,409 |
| 2014 | $6,916 | $20,000 | $3,000 | $17,000 |
| 2013 | $6,240 | $20,000 | $3,000 | $17,000 |
Source: Public Records
Map
Nearby Homes
- 8395 Archer Ave
- 8422 Archer Ave
- 8420 Archer Ave
- 815 Vinewood Ave
- 8473 Archer Ave Unit 204
- 106 Kazwell St
- 133 Rachel Ave Unit 501D
- 506 S Charleton St
- 8832 Rust St Unit 3
- 8832 Rust St Unit 1
- 8832 Rust St Unit 2
- 5 Cliffside Dr Unit 5
- 8611 Archer Ave
- Douglas Plan at Willow Springs Town Center
- 400 Village Cir Unit 109
- 400 Village Cir Unit 102
- 300 Village Cir Unit 203
- 300 Village Cir Unit 207
- 8764 Archer Ave
- 1048 Testa Dr
- 106 N Charleton St
- 106 N Charleton St
- 108 N Charleton St
- 108 N Charleton St
- 8386 Archer Ave
- 110 N Charleton St
- 110 N Charleton St
- 8382 Archer Ave
- 8374 Archer Ave
- 107 N Nolton Ave
- 107 N Nolton Ave
- 109 N Nolton Ave
- 109 N Nolton Ave
- 116 N Charleton St
- 105 N Charleton St
- 105 N Charleton St
- 8370 Archer Ave
- 8370 Archer Ave Unit 3
- 8370 Archer Ave Unit 2
- 8370 Archer Ave Unit 1